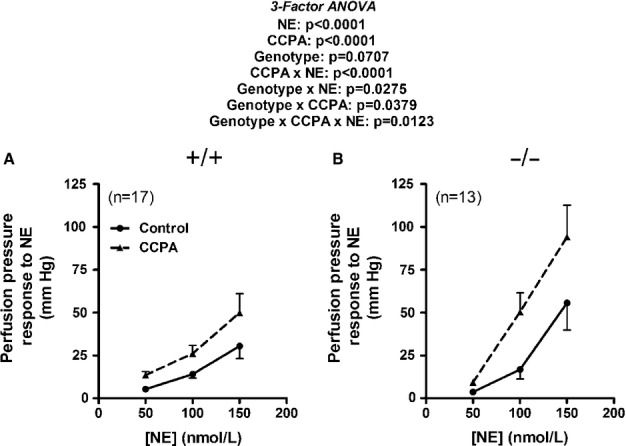
Figure 5.

Line graphs summarize changes in renal perfusion pressure in response to NE in kidneys from CD73+/+ (A) and CD73−/− (B) mice before and during treatment with 2-chloro-N6-cyclopentyladenosine (CCPA; 100 nmol/L). In CD73+/+ kidneys, basal perfusion pressures were 40 ± 2 and 44 ± 2 mm Hg before and during CCPA, respectively. In CD73−/− kidneys, basal perfusion pressures were 38 ± 1 and 39 ± 1 mm Hg before and during CCPA, respectively. P-values in panels are from nested three-factor analysis of variance. All values represent means ± SEM.
