
Figure 3.
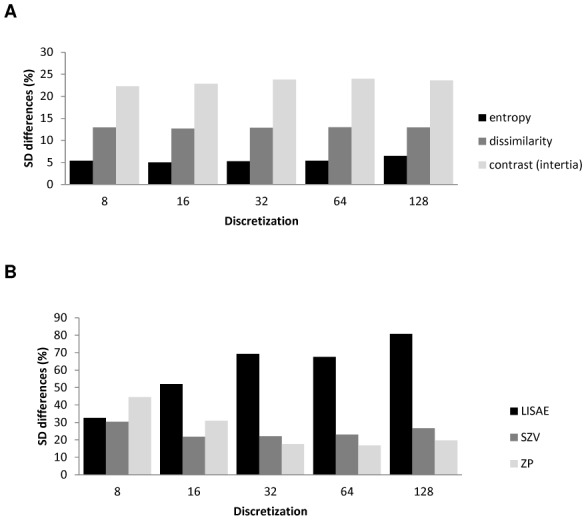
Plots showing the standard deviation of the mean percentage difference as a function of the discretization value for parameters derived from co-occurrences matrices (entropy, dissimilarity, contrast) (A) and intensity size-zone matrices (LISAE: Low-intensity small-area emphasis, SZV: Size-zone variability, ZP: zone percentage) (B).