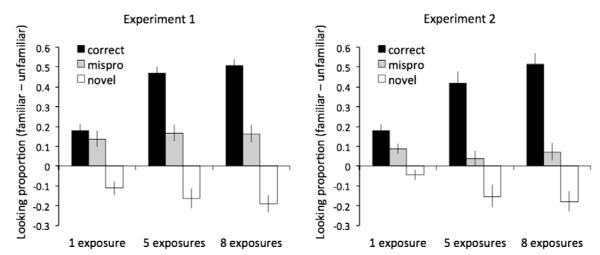
Fig. 3.

Familiar–unfamiliar looking proportion (averaged across the trial) from Experiments 1 and 2. Leftmost bars represent 1-exposure conditions, middle bars 5-exposure conditions, and rightmost bars 8-exposure conditions. Vertical bars indicate standard errors.
