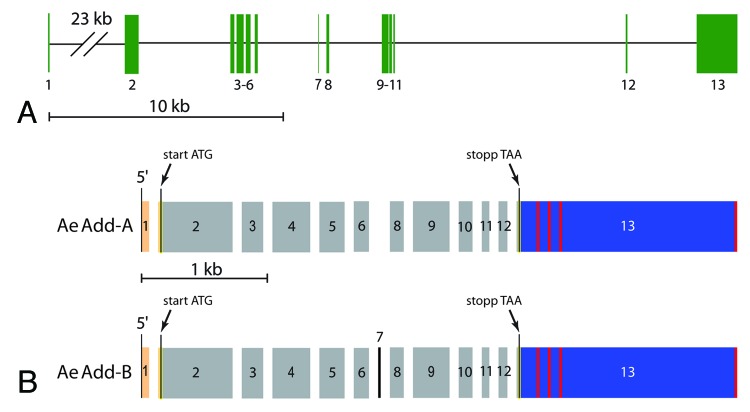
Figure 1. Aedes adducin gene. (A) map of Aedes adducin gene as predicted by the Aedes genome.69 Numbered, vertical green bars are exons, horizontal black lines are introns. For more detail see Table 2. (B) fractured exon map of adducin cDNAs cloned from Aedes Malpighian tubules. Numbers refer to the exons in panel A. Orange and blue bars correspond respectively to the 5′‑ and 3′‑untranslated regions which flank the open-reading frame (gray and black). Vertical red bars indicate poly‑adenylation sites. Note the presence of exon 7 in AeAdd‑B and its absence in AeAdd‑A.

An official website of the United States government
Here's how you know
Official websites use .gov
A
.gov website belongs to an official
government organization in the United States.
Secure .gov websites use HTTPS
A lock (
) or https:// means you've safely
connected to the .gov website. Share sensitive
information only on official, secure websites.
