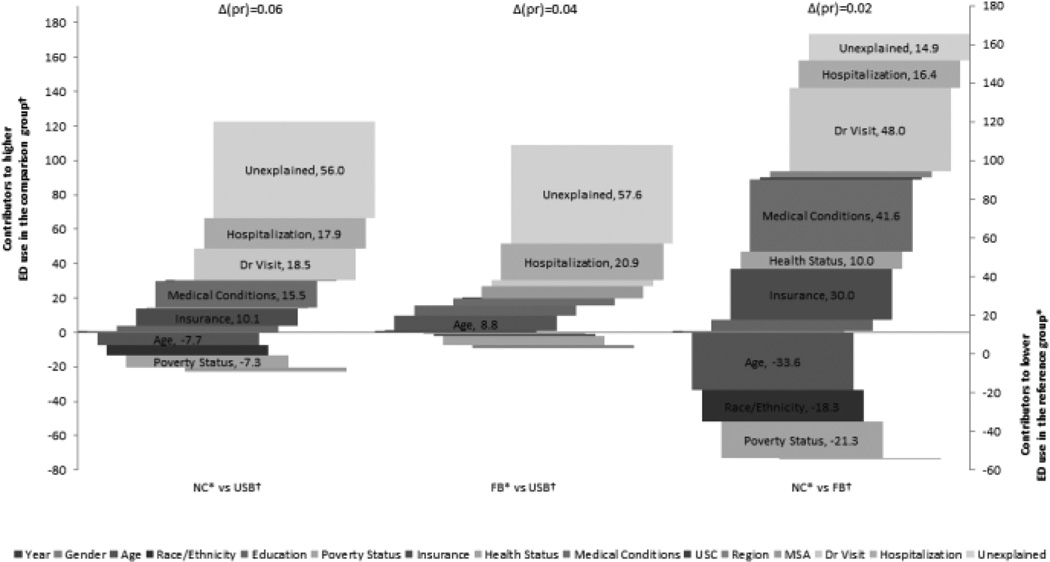
Figure 2.
Non-linear (Fairlie) decompositon of differences in expected probability of emergency department use between adult (18-years and older) citizenship groups in the United States. Results are from the Medical Expenditures Panel Survey (2000–2008).
Δ(pr) is the difference in the expectedprobability of use between the reference and comparison groups
† Comparison group
* Reference group
Note 1: “Non” indicates non-citizens, “FB” indicates foreign-born citizens and “USB” indicates US-born citizens.
Note 2: Only statistically significant factors are emphasized.
Note 3: Bars included in the negative quadrant of the graph represent factors that contribute to higher probability of use in the reference groups. Bars included in the positive quadrant of the graph represent factors that increase the probability of use among the comparison groups. The width of each included bar represents the percentage of between group difference in the probability (i.e. Δ(pr)) of reporting ED use explained by the factor or, more specifically, the expected change in difference if both groups had similar factor characteristics. The sum of the positive (including unexplained) and negative contributors add up to 100% of the difference between the compared groups.

