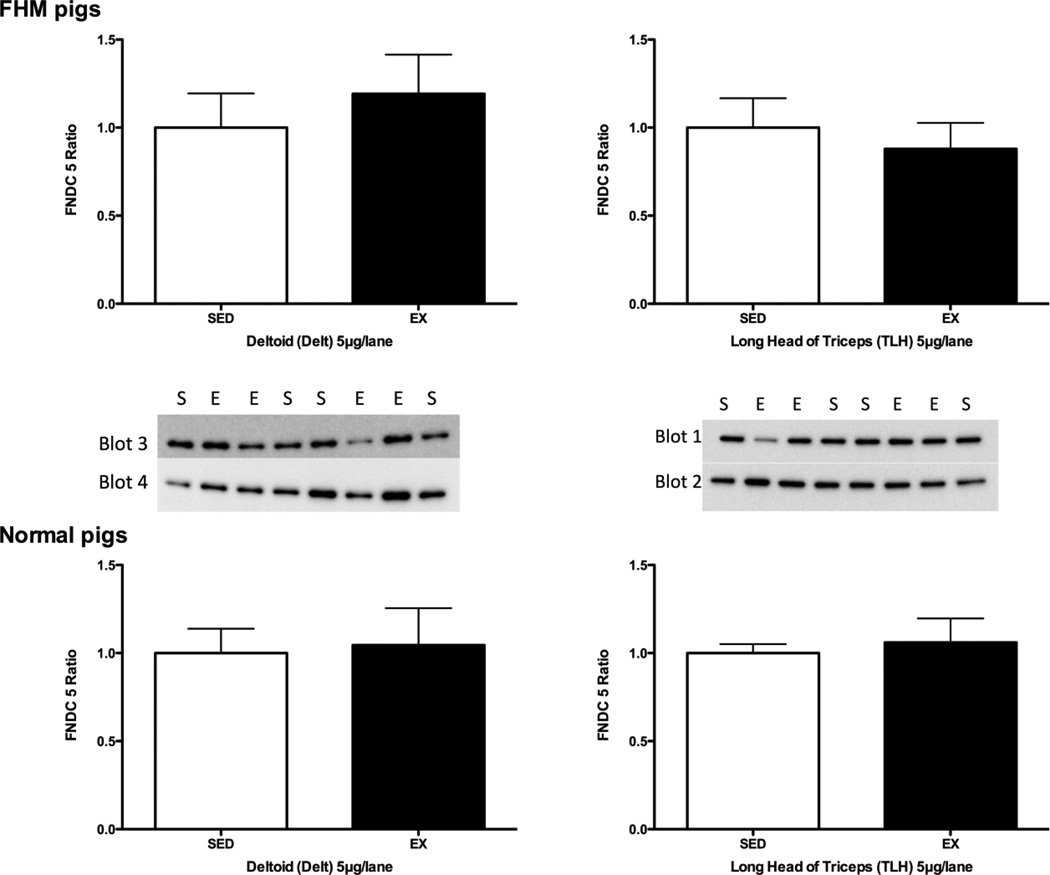
Figure 2.
Immunoblot results for FNDC5 immuonreactivity in deltoid and long head of the triceps brachii muscles of normal and FHM pigs. The data are shown as the ratio of the means of immunoreactivity in exercise trained (EX) relative to that of FHM pigs that did not train on the treadmill (SED). The data in the top part of the figure are for 5 exercise-trained and 8 sedentary FHM pigs while the bottom shows data for 8 exercise-trained and 8 sedentary normal pigs for samples that were obtained at sacrifice. The SED values on each blot were averaged and then the data on that blot were expressed relative to the SED mean value. The blots for each muscle sample used to calculate the means of the normal pigs are also shown.

