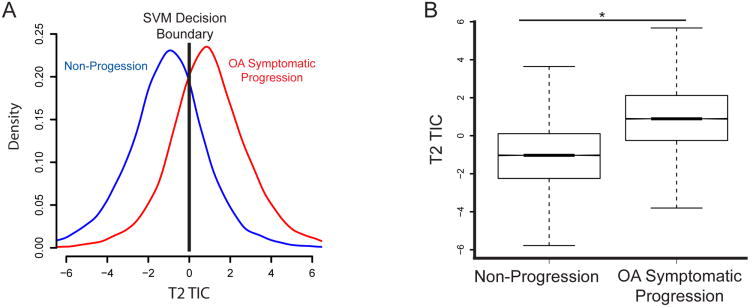
Figure 2. T2 TIC identifies early signs of OA on T2 maps.
(A) Histograms of the T2 TIC for the non-progression and OA progression populations. A positive score corresponds to a decision of symptomatic OA, and a negative score indicates a decision of asymptomatic. Accuracy is 76%. The SVM decision boundary is indicated by the black line. Results shown are based on 1000 trials, with on average 22 features needed to build the T2 TIC. (B) Notched box plots comparing the control and OA populations. The notched line is visualized as the bold line at the median as the confidence interval is small.* p<0.05.

