
Figure 1. Increased expression of miR-146a, miR-155, miR-29a, and miR-29b in the brain of aged mice.
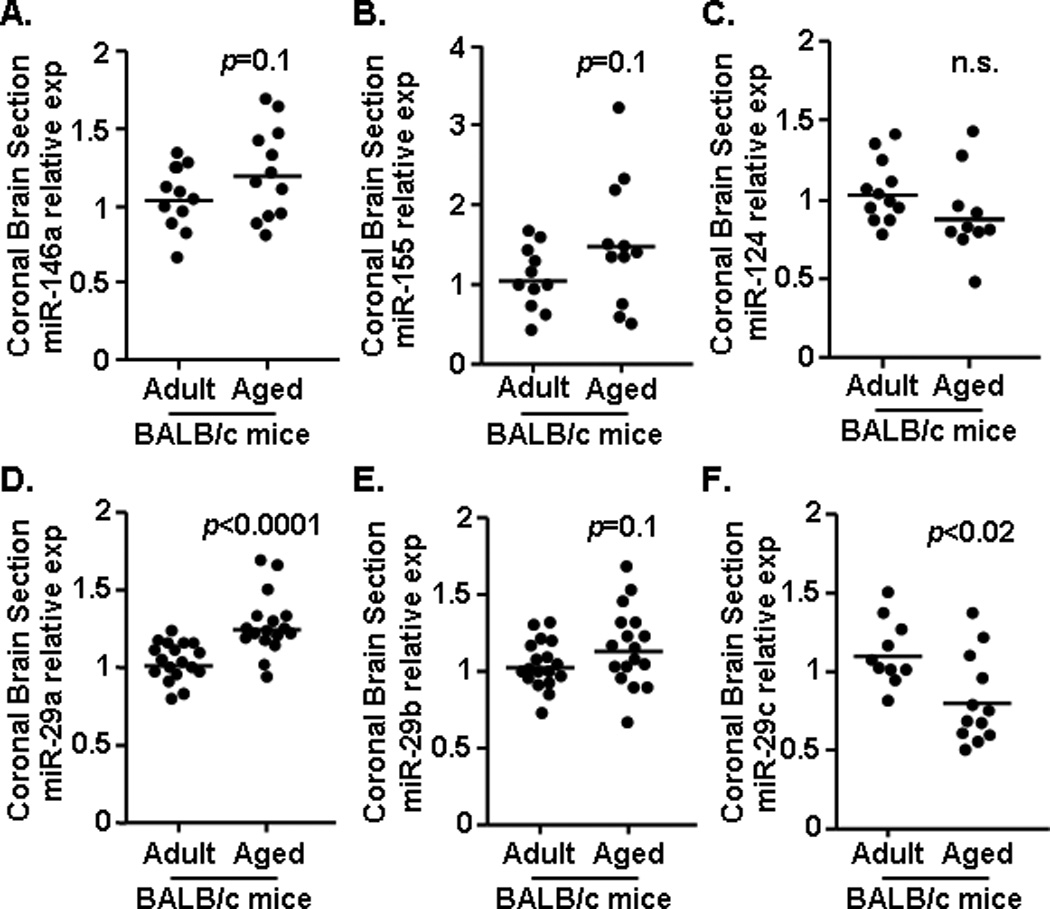
A 1 mm coronal brain section (−0.5 Bregma) was collected from adult (n=12–17) and aged (n=12–18) mice and levels of A) miR-146a, B) miR-155, C) miR-124 D) miR-29a, E) miR-29b, and F) miR-29c were determined. Samples represent three independent experiments and are presented as fold change compared to Adult. Horizontal bars represent the mean with each dot depicting a separate sample.