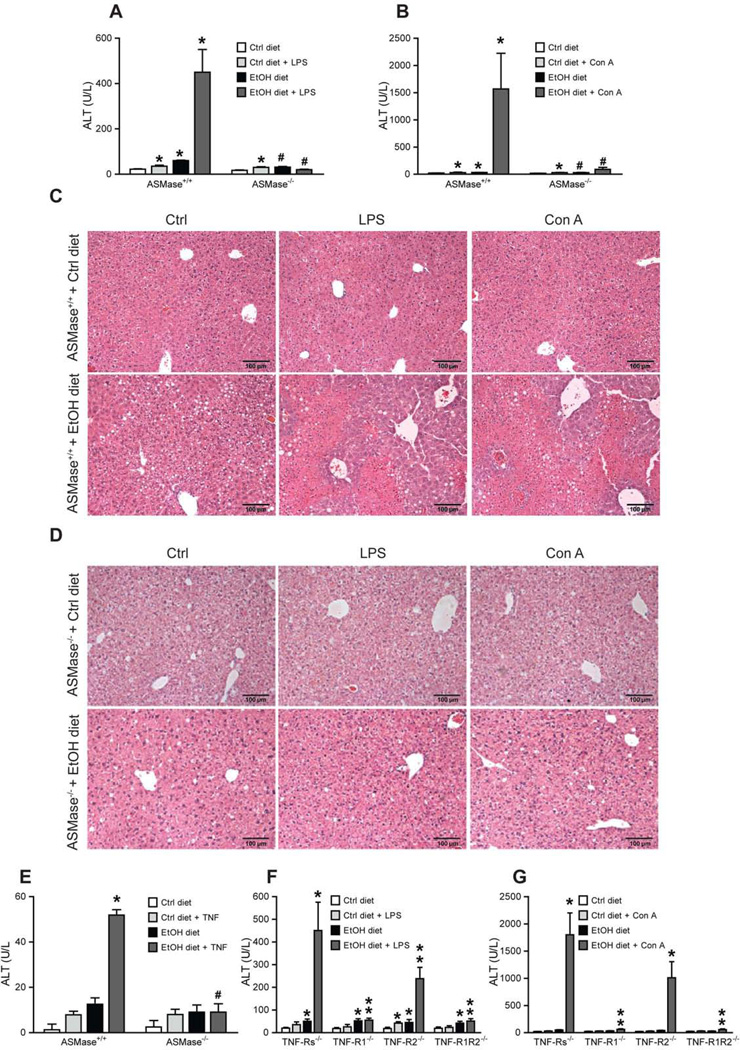
Fig 3. ASMase and TNFR1 deficiency prevent alcohol-induced sensitization to LPS/ConA.
Plasma and liver samples from alcohol-fed mice challenged with LPS or ConA were processed ALT (A, B) and histology analyses (C, D). (E) Susceptibility of primary hepatocytes to TNF (280ng/ml, 16h). Results are the mean ± SD (6–8 mice per group). A-B, *p<0.05 vs. WT mice fed control diet, #p<0.05 vs. WT mice fed ethanol; E, *p<0.05 vs. Ctrl+TNF; #p<0.05 vs. WT ethanol fed +TNF. ALT levels from TNF receptors null mice challenged with LPS (F) or con-A (G). Results are the mean ± SD (7–9 mice per group). *p<0.05 vs. WT mice fed control diet; **p<0.05 vs. WT mice fed ethanol diet+LPS or ConA.

