
Figure 6. Comparison of LOS·MD-2[125I] dose-dependent binding to and cell activation of HEK293T cells transiently transfected with full-length wt (A) or D299G.T399I (B) TLR4.
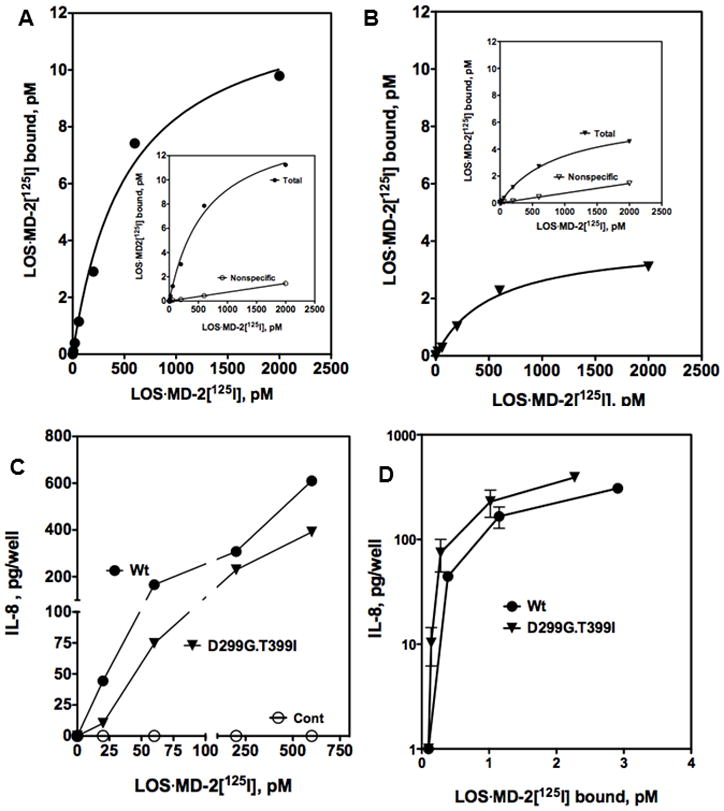
Binding of increasing concentrations of LOS·MD-2[125I] to HEK293T cells transiently transfected (PolyFect) with either wt or D299G.T399I TLR4 or control vector (1 million cells/sample) during 30 min incubation at 37°C was performed as described in Materials and Methods and Prohinar et al.17 Inserts in A and B show dose-dependent LOS·MD-2[125I] bound after incubation with TLR4 transfected cells (total) and mock transfected cells (non-specific). Specific binding, shown as a saturation curve in A and B, was calculated as the difference between total and non-specific cpm bound. Scatchard analyses of these data by GraphPad Prism were used to determine Kd and Bmax: Kd = 528 ± 100 pM and Bmax = 12.7 ± 0.9 pM with wt TLR4 cells and Kd = 531 ± 74 pM and Bmax = 4.0 ± 0.2 pM with D299G.T399I TLR4 cells. (C) Dose-dependent cell activation by LOS·MD-2[125I] of transiently transfected wt, D299G.399I TLR4, or mock transfected cells was measured as extracellular accumulation of secreted IL-8 by ELISA as described in Materials and Methods. Results shown are from one experiment representative of at least three experiments with each dose in triplicate. In (D) the amount of TLR4-dependent cell activation as measured by IL-8 secretion is plotted as a function of the amount of LOS·MD-2[125I] bound to wt or D299G.T399I TLR4 cells. Data are compiled from dose curves of binding and cell activation by LOS·MD-2[125I] to wt and D299G.T399I TLR4 as represented in A, B, and C.