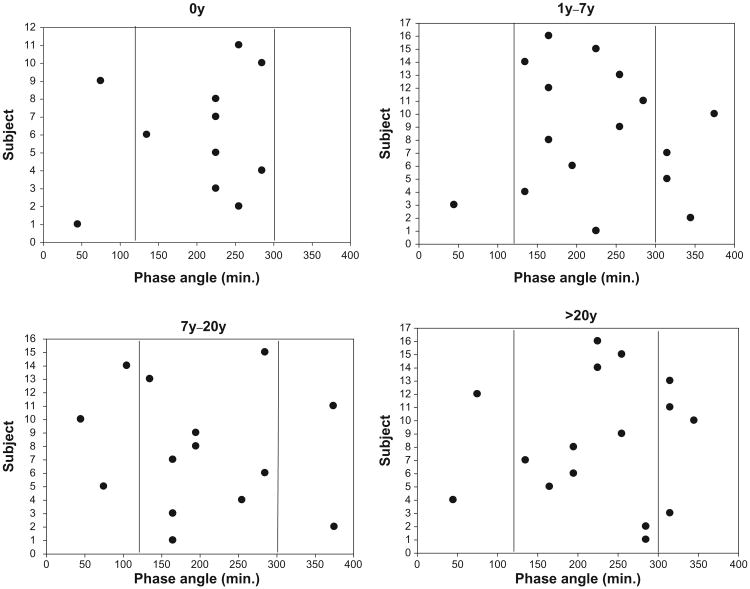
Figure 2.
Individual phase angles for each subject within the four shift work exposure groups (0y, 1y–7y, 7y–20y, >20y).
Notes: Plotted is the number of minutes elapsing between bedtime and the circadian temperature rhythm trough (see text). The two vertical lines represent the outer bounds of “usual” phase angles (120 mins [2h] and 300 mins [5h]).

