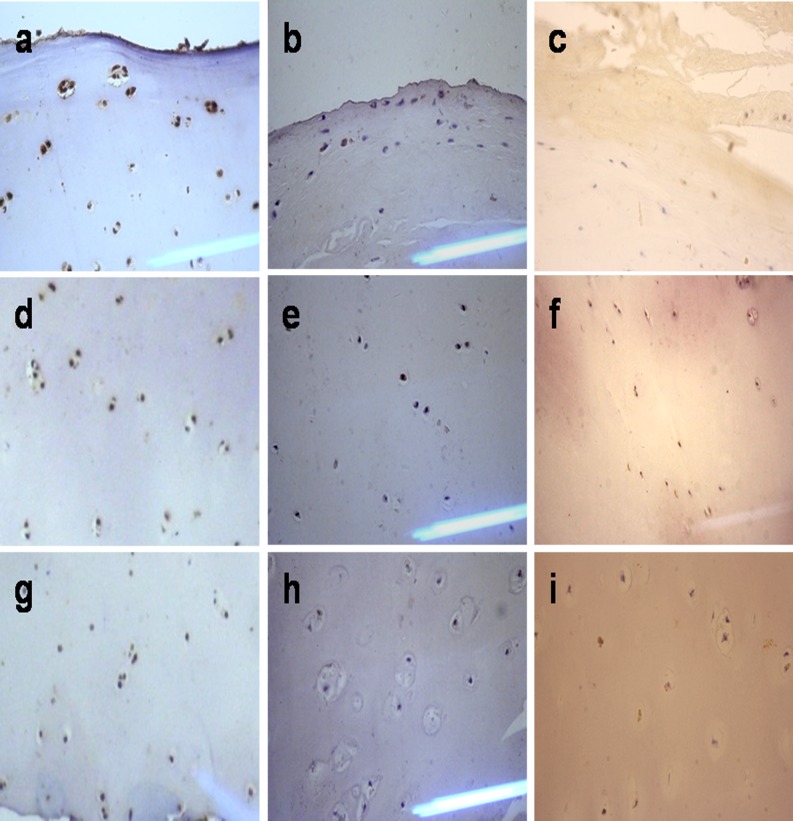
Fig. 4.
Comparison of Hapln-1 expression in the cartilage from osteoarthritis (OA), Kashin-Beck disease (KBD) and normal groups. a, b, c Denote the upper of normal, OA and KBD cartilage, respectively. d, e, f Denote the middle of normal, OA and KBD cartilage, respectively. g, h, i Denote the deep of normal, OA and KBD cartilage, respectively

