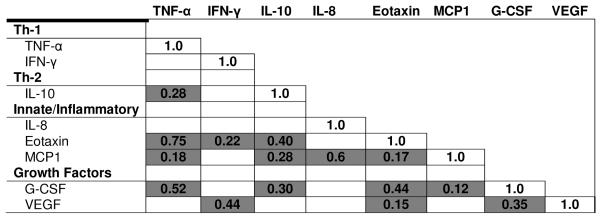
Table 2.
Pair wise Spearman rank correlation coefficients for plasma cytokines among rural women from Nigeria*.

|
Correlations performed for cytokines detected in ≥50% of samples and with a C.V. <30 using untransformed values. Only correlations that are significant at p<0.05 after Bonferroni correction are tabulated.
