

Abstract
The purpose of this study was to investigate the effects of 1st-grade number knowledge tutoring with contrasting forms of practice. Tutoring occurred 3 times per week for 16 weeks. In each 30-min session, the major emphasis (25 min) was number knowledge; the other 5 min provided practice in 1 of 2 forms. Nonspeeded practice reinforced relations and principles addressed in number knowledge tutoring. Speeded practice promoted quick responding and use of efficient counting procedures to generate many correct responses. At-risk students were randomly assigned to number knowledge tutoring with speeded practice (n = 195), number knowledge tutoring with nonspeeded practice (n = 190), and control (no tutoring, n = 206). Each tutoring condition produced stronger learning than control on all 4 mathematics outcomes. Speeded practice produced stronger learning than nonspeeded practice on arithmetic and 2-digit calculations, but effects were comparable on number knowledge and word problems. Effects of both practice conditions on arithmetic were partially mediated by increased reliance on retrieval, but only speeded practice helped at-risk children compensate for weak reasoning ability.
Keywords: mathematics, practice, fluency, arithmetic, word problems
Large-scale studies in the United Kingdom indicate nearly one in four adults are without the mathematics competencies needed to take full advantage of employment opportunities and handle critical daily life activities (Bynner, 1997; Every Child a Chance Trust, 2009). This situation extends to the United States (Institute of Education Sciences, National Center for Education Statistics, 2009; National Mathematics Advisory Panel, 2008), and functional innumeracy is more common among adults than reading problems due in part to stronger early intervention for reading. In fact, children with lower performance than peers in basic quantitative knowledge early in school tend to remain behind throughout their schooling (Duncan et al., 2007). Skill in whole number addition at the start of first grade predicts mathematics learning through the end of fifth grade (Geary, 2011) and is an indicator of risk for long-term learning disabilities (Geary, Hoard, Nugent, & Bailey, 2012). The National Mathematics Advisory Panel (2008) concluded that early mastery of simple arithmetic is a critical step toward eventual mastery of high school algebra, a gateway for later entry into mathematics-intensive fields. These factors point to the importance of early mathematics intervention and the need for a strong focus on arithmetic in that intervention.
In the present study, we investigated the effects of number knowledge tutoring with contrasting forms of practice on at-risk first graders’ emerging competence with simple arithmetic (e.g., 7 + 2; 9 − 4). We also assessed two-digit calculations (e.g., 16 + 51), number knowledge (e.g., cardinality), and word problems. The major emphasis in tutoring was developing interconnected knowledge of numbers, but a small portion of each session was devoted to practice. In one condition, practice was designed to reinforce the relations and principles that serve as the basis of reasoning strategies that support fact retrieval. The other form of practice was designed to promote quick responding and use of efficient counting procedures to generate many correct responses and thereby form long-term representations to support retrieval. Both practice conditions occurred on the same content, encouraged strategic behavior, and provided immediate corrective feedback.
So there were two major distinctions between the two forms of practice. First, one condition encouraged a variety of number-principle strategies including (but not limited to) relying on number lists, arithmetic principles (e.g., cardinality, commutativity principle, and subtraction as the inverse of addition), and efficient counting procedures; in the other condition, only efficient counting strategies were encouraged. Second, in the condition that encouraged a variety of strategic behaviors, practice was not focused on speeded execution of the chosen strategy; the focus instead was on executing strategies thoughtfully to emphasize number knowledge. By contrast, in the condition that relied exclusively on counting strategies, practice was speeded, with an emphasis on executing counting strategies quickly. Readers should be mindful of these two distinctions, because in this article, we use the terms non-speeded practice and speeded practice to refer to these conditions.
To understand the efficacy of number knowledge tutoring when combined with speeded or with nonspeeded practice, we compared each tutoring condition against an at-risk no-tutoring control group that received the same classroom instruction as the tutored groups. To understand how the type of practice affects learning, we contrasted the two tutoring conditions against each other. To provide insight into whether different forms of tutoring help narrow the achievement gap, we included a group of low-risk classmates as a second (no-tutoring) control group, who received the same classroom instruction as the at-risk tutored and control groups. Finally, we assessed processes by which tutoring effects occurred. Note that we also examined effects on children’s attitudes, motivation, and effort. We found no differences in these outcomes as a function of study condition. See the online supplemental materials for the method and results. We begin with an overview of children’s early arithmetic development, followed by a summary of randomized control trials assessing the efficacy of first-grade mathematics tutoring. We then discuss the processes by which the two forms of tutoring may facilitate arithmetic learning.
Development of Arithmetic Competence
By the time children enter first grade, most have a rudimentary understanding of addition and subtraction and can count to solve these problems (Geary, 1994). For addition, young children typically count both addends; for subtraction, they represent the beginning quantity (the minuend) with objects and sequentially separate the number of objects to be subtracted (the subtrahend) and then count the remaining set (e.g., Groen & Resnick, 1977). As understanding of cardinality and the counting sequence develops, children discover the number-after rule for adding with 1. They also understand the sum of 5 + 2 cannot be 6 but instead is two numbers beyond 5. In this way, children discover the efficiency of counting from the first addend and rely on more efficient counting procedures. For addition, the most efficient counting procedure involves starting with cardinal value of the larger addend and counting up the number of times equal to the smaller addend (e.g., 4 + 3 = “four: five, six, seven”); for subtraction, counting up involves starting with the subtrahend and counting to the minuend (e.g., 5 − 2 = “two: three, four, five”; the number of counts is the answer). Frequent use of efficient counting procedures reliably produces the correct association between problem and answer, which produces long-term memories (Fuson & Kwon, 1992; Siegler & Robinson, 1982; Siegler & Shrager, 1984). This enables direct retrieval of answers, and the commutativity of addition facilitates retrieval of related addition problems (Campbell & Xue, 2001; Rickard, Healy, & Bourne, 1994). Subtraction, which is not commutative, is more difficult but can be facilitated by retrieval of related addition facts (e.g., 8 − 5 = 3, based on 5 + 3 = 8; LeFevre & Morris, 1999), once children understand the inverse relation between addition and subtraction (Geary, Boykin, et al., 2008).
Students with mathematics learning disabilities show consistent delays in the adoption of efficient counting procedures, make more counting errors during their execution, and fail to make the shift toward memory-based retrieval (e.g., Geary et al., 2012; Goldman, Pellegrino, & Mertz, 1988). Most of these children eventually catch up to peers in skilled use of counting procedures, but difficulty with retrieval tends to persist (Geary et al., 2012; Jordan, Hanich, & Kaplan, 2003). They retrieve fewer answers from memory, and when they do retrieve answers, they commit more errors (e.g., Geary, Brown, & Samaranayake, 1991; Geary, Hoard, Byrd-Cravan, Nugent, & Numtee, 2007).
In the present study, we examined two forms of tutoring for improving performance in simple addition and subtraction in first-grade children at risk for poor mathematics outcomes. The major focus in both forms of tutoring was the number knowledge (e.g., cardinality) and relations (e.g., inverse relation between addition and subtraction) that facilitate the use of sophisticated counting procedures or retrieval-based processes (e.g., commutativity). The tutoring conditions differed in terms of how practice occurred. Mathematics educators caution against drill and rote memorization of arithmetic combinations before children have sufficient number knowledge (e.g., National Research Council, 2001; Rathmell, 1978), but many view meaningful practice as important for achieving fluency. The National Mathematics Advisory Panel (2008) concluded automaticity of fact retrieval is important for long-term mathematics success. Geary, Boykin, et al. (2008) hypothesized that practice is important for building automaticity, which may help limit the potentially detrimental effects of the cognitive resource (e.g., working memory, nonverbal reasoning) demands associated with solving mathematics problems (Geary & Widaman, 1992). At the same time, it is unclear how best to structure practice. In the present study, nonspeeded practice was designed to reinforce the relations and principles that serve as the basis of reasoning strategies that support retrieval. Speeded practice was designed to promote quick responding and use of efficient counting procedures to generate many correct responses, which supports formation of is representations in long-term memory and retrieval (e.g., Fuson & Kwon, 1992; Siegler & Shrager, 1984). It is, however, possible that such speeded practice is detrimental to number knowledge learning or word-problem performance by encouraging rote responding. We attempted to avoid this problem by contextualizing speeded practice with the number knowledge portion of the lessons.
Mathematics Tutoring for At-Risk Learners
Although we identified no randomized control studies contrasting different forms of practice, we did locate four randomized control trials assessing intervention efficacy for first-grade students at risk for poor mathematics outcomes. Fuchs, Fuchs, Hamlett, Powell, Capizzi, and Seethaler (2006) conducted a randomized control trial to assess the efficacy of practice alone. An addition or subtraction problem with its answer briefly flashed on a computer screen; then students generated the problem and answer from short-term memory. This is in line with Geary’s (1993) proposal that practice strengthens retrieval when problems and answers are simultaneously active in working memory. Compared with an analogous computer-assisted spelling practice condition, arithmetic practice (10 min, twice weekly for 18 weeks) produced significantly better performance for addition but not for subtraction; effect sizes (ESs) were .95 and −.01, respectively. Other mathematics outcomes were not assessed.
Two randomized control trials combined number knowledge tutoring with practice and assessed a broader range of outcomes. In Fuchs et al. (2005), tutoring occurred 3 times per week for 16 weeks. Each session included 30 min of tutor-led instruction designed to build number knowledge plus 10 min of computerized arithmetic practice, as just described. Results favored tutoring over a no-tutoring control group on measures of concepts and applications (ES = .67), procedural calculations (ES = .40–.57), and word problems (ES = .48), but effects were not reliable on simple arithmetic (ESs = .15–.40). Bryant et al. (2011) also integrated tutoring on number knowledge with practice (4 times per week for 19 weeks). In each session, 20 min were devoted to number knowledge and 4 min to practice, which focused on arithmetic problems, as well as reading numerals, counting on/back, writing dictated numerals, and writing 3-number sequences. Effects were significantly stronger for tutoring compared with a no-tutoring control group on simple arithmetic (ES = .55), place value (ES = .39), and number sequences (ES = .47). But tutoring did not enhance word-problem outcomes (ESs= −.05 and .07).
In the only randomized control trial to focus exclusively on number knowledge, Smith, Cobb, Farran, Cordray, and Munster (2011) evaluated Math Recovery (MR), in which tutors adapt lessons to meet student needs as reflected on MR assessments. Tutors introduce tasks and have students explain their reasoning, but practice is not provided. Tutoring was to occur 4–5 times per week, 30 min per session across 12 weeks, but the median number of sessions was 32. At end of first grade, effects favored MR over the control group on fluency with simple arithmetic (ES = .15), concepts and applications (ES = .28), quantitative concepts (ES = .24), and math reasoning (ES = .30). Effects were stronger for students whose performance when they began to receive tutoring was below the 25th percentile (.31–.40) but generally have been smaller than in the other studies. Comparisons are, however, difficult because this study allowed fidelity to vary, whereas the other studies tried to ensure fidelity.
These randomized control trials suggest potential for tutoring, compared with no tutoring, for enhancing some forms of mathematics learning among at-risk first graders. Prior work does not, however, provide the basis for understanding how to conduct practice or the processes by which different forms of practice facilitate or inhibit learning.
Processes Underlying Simple Arithmetic Development
In studying processes, we sought to extend two bodies of work. The first concerns the strategies by which arithmetic competence develops. As discussed, in solving simple arithmetic problems, children begin by relying on counting strategies that become increasingly sophisticated as number knowledge grows. This helps children generate correct responses to establish representations in memory, after which children begin to favor direct retrieval (Geary et al., 2012). To date, randomized control trials have not investigated how different forms of tutoring contribute to at-risk children’s development of strategic problem solving. In the present study, because the number knowledge portion of tutoring addressed the relations and principles that support counting strategies and retrieval, we expected both tutoring conditions to increase proficiency with counting and reliance on retrieval relative to at-risk control students. However, because speeded practice was designed to generate many more correct responses than non-speeded practice, by requiring fast execution of efficient counting strategies, we expected speeded practice to exceed nonspeeded practice in terms of the emergence of the most sophisticated counting strategies as well as retrieval. We also expected shifts in retrieval and counting to be causally involved in (to mediate) the effects of tutoring on arithmetic competence.
Our second approach for understanding processes centers on the role of domain-general cognitive resources, such as working memory or nonverbal reasoning, in mathematics development (e.g., Fuchs, Geary, Compton, Fuchs, Hamlett, Seethaler, et al., 2010; Geary et al., 2012; Krajewski & Schneider, 2009; Kroesbergen, Van Luit, Van Lieshout, Van Loosbroek, & Van de Rijt, 2009). Our hypothesis was that speeded practice, with its focus on directly building long-term representations of arithmetic combinations, reduces demands on the cognitive abilities associated with mathematics development. We were also interested in contrasting the role of cognitive resources on arithmetic outcomes to word-problem outcomes, because prior work suggests the cognitive resources contributing to these two forms of mathematics competence differ. We therefore measured children’s cognitive resources that uniquely predict arithmetic or word-problem learning.
In terms of arithmetic, research provides the basis for hypothesizing a role for nonverbal reasoning, working memory, attentive behavior, processing speed, and phonological processing. Nonverbal reasoning contributes to arithmetic learning, perhaps due to its role in understanding the relations and principles involved in arithmetic (Geary et al., 2012) and mathematics more generally (e.g., Deary, Strand, Smith, & Fernandes, 2007; Taub, Floyd, Keith, & McGrew, 2008). The central executive component of working memory may be needed to maintain simultaneous activation of problems and answers in working memory while one is counting solutions (e.g., Fuchs, Geary, Compton, Fuchs, Hamlett, Seethaler, et al., 2010; Geary, Hoard, & Nugent, in press; Swanson & Sachse-Lee, 2001). Whereas the central executive maintains the attention needed to use a counting strategy, the representation of the number words during the act of counting is stored in the phonological loop (e.g., Fuchs et al., 2005; Hecht, Torgesen, Wagner, & Rashotte, 2001; Logie & Baddeley, 1987; Swanson & Beebe-Frankenberger, 2004). Attentive behavior also independently predicts arithmetic development (e.g., Fuchs, Geary, Compton, Fuchs, Hamlett, & Bryant, 2010; Geary et al., 2012), but the relation between this type of attention and the attentional control component of the central executive is not well understood. The search for processes underlying arithmetic is further complicated by the relation between working memory and speed of processing, as the latter may also support efficient counting and formation of correct associations between problems and answers. It has also been identified as predictive of arithmetic performance (Bull & Johnston, 1997; Fuchs, Fuchs, Stuebing, et al., 2008; Hecht et al., 2001).
The set of predictors of arithmetic and word problems may, however, differ. Swanson (2006) identified controlled attention, vocabulary knowledge, and visual spatial working memory as predictors of performance on calculation problems (e.g., 12 + 36), but the central executive control component of working memory was associated with word-problem performance. Fuchs, Geary, Compton, Fuchs, Hamlett, Seethaler, et al. (2010) found that the central executive component of working memory, in the form of counting span, was uniquely predictive of arithmetic performance. By contrast, listening comprehension, attentive behavior, nonverbal reasoning, and central executive listening span predicted word-problem performance. Across these and other studies, listening comprehension, working memory, nonverbal reasoning, and attentive behavior appear active in word-problem development.
We identified only one prior study examining how cognitive resources moderate the effects of practice in mathematics instruction. Anderson (1941) found that rote practice enhanced learning for overachievers, but meaning instruction facilitated learning for underachievers. This interaction was dismissed, however, when Cronbach and Webb (1975) controlled for variance associated with classroom instruction in a reanalysis of Anderson’s data. This illustrates the importance of controlling for variance at the classroom level, as was done in the present study, in which we investigated whether and, if so, how cognitive resources moderate the effects of different forms of tutoring.
Method
Overview
We identified at-risk students early in first grade and randomly assigned them to number knowledge + nonspeeded practice tutoring, number knowledge + speeded practice tutoring, or no-tutoring control. We also included a sample of low-risk (non-tutored) classmates, as a second control group, to provide insight on the extent to which different forms of tutoring help narrow the achievement gap.1 Tutoring occurred for 16 weeks, 3 times per week, 30 min per session. In both tutoring conditions, 25 of each 30-min session were the same, designed to foster number knowledge. The last 5 min, which involved practice, differed. Non-speeded practice focused on the relations and principles addressed in the number knowledge portion of tutoring; children relied on these relations and principles when unsure of answers and to correct errors. Speeded practice was designed to promote fluency by requiring quick responding and use of efficient counting procedures in rote fashion; children relied on counting strategies when unsure of answers and to correct errors. Both practice conditions occurred on the same content, encouraged strategic behavior, and provided immediate corrective feedback. To gain insight into the processes by which effects occurred, we assessed the strategies children used to solve addition problems before and after intervention, and we assessed performance on domain-general cognitive resources prior to intervention.
Participants
After obtaining central office permission to conduct this study in a metropolitan school district in the Southeast, we contacted principals, according to our institutional review board protocol, to describe the study and ask permission to meet with first-grade teachers to explain the study and determine their interest in participating. Across four cohorts in four consecutive years, we recruited 40 schools and 233 classes, in which we screened students to identify subsets of children with and without risk. Our goal (as per a power analysis) was to enroll 648 first graders at risk for poor mathematics achievement and 325 low-risk classmates. Consent was provided for 3,051 (74%) of 4,141 children; 2,806 were present for screening (on average, 1.05 students per class were absent). See the Appendix for screening measures. Because no true cut point exists for academic risk, we relied on a latent class approach in the first year to designate at-risk and low-risk status by combining the screening scores into a single latent factor.2 For the remaining cohorts, we used the first-year cut points to ensure consistency.
In selecting students to enter the study, we excluded 359 students whose teachers identified them as not speaking English and 59 students with standard scores below 80 on both subtests or the two-subtest Wechsler Abbreviated Intelligence Scale (WASI; Wechsler, 1999). We then randomly sampled 973 students, stratifying by risk status and classroom (with no more than eight students in the same class). Participants were 648 at-risk and 325 low-risk students in 227 classes. At-risk students were randomly assigned at the individual level while stratified by class to the three conditions.
During first grade. 57 (8.9% of) at-risk students and 25 (7.7% of) low-risk students moved to schools outside the district. This left 190 in the number knowledge tutoring + nonspeeded tutoring group, 195 in the number knowledge tutoring + speeded practice group, 206 at-risk no-tutoring control group, and 300 low-risk control group. Little’s (1988) MCAR test indicated data were missing completely at random; so students who left the district prior to the end of the study were dropped without introducing significant bias. For the remaining cases, there were no missing data. See Table 1 for demographic data, screening data, and standard scores on the Wide Range Achievement Test–3 (WRAT–3; Wilkinson, 1993) and WASI–IQ by condition. As shown elsewhere (e.g.. Fuchs, Fuchs, Sluebing, et al., 2008), compared with low-risk students, at-risk children were disproportionately African American and recipients of subsidized lunches, but the three at-risk groups were demographically comparable. On WRAT and WASI–IQ, low-risk students exceeded children in each of the at-risk study groups, which were comparable.
Table 1.
Demographic and Descriptive Data by Study Condition
| Variable | Low-risk no-tutoring control (n = 300)
|
At-risk no-tutoring control (n =206)
|
At-risk number knowledge + speeded practice tutoring (n = 195)
|
At-risk number knowledge + nonspeeded practice tutoring (n = 190)
|
||||||||
|---|---|---|---|---|---|---|---|---|---|---|---|---|
| % | M | SD | % | M | SD | % | M | SD | % | M | SD | |
| Female | 51.3 | 50.0 | 48.2 | 53.2 | ||||||||
| Race | ||||||||||||
| African American | 39.7 | 72.8 | 67.7 | 66.8 | ||||||||
| White | 42.3 | 17.5 | 22.6 | 21.1 | ||||||||
| Hispanic | 8.3 | 6.3 | 6.7 | 7.8 | ||||||||
| Kurdish | 1.3 | 0.5 | 0.5 | 0.0 | ||||||||
| Other | 8.3 | 2.9 | 2.6 | 4.2 | ||||||||
| Subsidized lunch program | 59.0 | 87.4 | 85.1 | 79.5 | ||||||||
| Identified disability | 2.0 | 12.2 | 16.7 | 15.4 | ||||||||
| Screen | ||||||||||||
| Computation | 8.86 | 5.62 | 2.02 | 2.33 | 1.96 | 2.12 | 1.88 | 1.93 | ||||
| Concepts/applications | 15.83 | 4.65 | 7.34 | 3.20 | 7.30 | 3.40 | 7.41 | 3.41 | ||||
| Word ID fluency | 38.66 | 23.68 | 12.49 | 13.84 | 10.74 | 12.05 | 11.23 | 11.84 | ||||
| WRAT–Reading standard score | 114.22 | 15.80 | 99.04 | 13.89 | 98.62 | 10.65 | 100.45 | 12.54 | ||||
| WRAT–Arithmetic standard score | 107.14 | 11.96 | 88.87 | 12.16 | 89.19 | 11.72 | 89.52 | 12.87 | ||||
| WASI IQ | 100.36 | 13.36 | 85.67 | 8.06 | 85.79 | 7.82 | 85.47 | 8.43 | ||||
Note. ID = identification; WRAT = Wide Range Achievement Test; WASI = Wechsler Abbreviated Scale of Intelligence.
Tutoring
Overview
Tutoring occurred one-to-one, 3 times per week, 30 min per session for 16 weeks in a quiet location in the child’s school, outside the classroom. Absences and snow days were made up to ensure each student received a minimum of 48 sessions. To foster engagement, the program uses a space theme (e.g., children are encouraged to “blast off into the math galaxy” by improving their mathematics knowledge; some manipulatives are shaped as space rockets), and both tutors and children refer to the program as Galaxy Math (Fuchs, Fuchs, & Bryant, 2010; Galaxy Math is related to Number Rackets). In the present study, each lesson was divided into two segments; a 25-min lesson designed to improve number knowledge and 5 min of nonspeeded or speeded practice. The nature and content of the first 25-min segment was the same for all tutored students. In the 5-min segment, the content was also the same (i.e., topics covered during the first 25 min), but activities depended on condition.
Segment 1: Tutoring designed to promote number knowledge
See Table 2 for an overview of lessons, organized in five units. Unit 1 (Lessons 1–18) addresses basic number knowledge. Unit 2 (Lessons 19–20) focuses on arithmetic doubles (0 +0 through 6 + 6; 2 − 2 through 12 − 6). Unit 3 (Lessons 21–52) addresses Arithmetic Problem Sets 5 through 12 (e.g., the 5 Set includes all problems with sums or minuends of 5; we use the term sets, as in the 5 Set). Unit 4 (Lessons 53–66) focuses on concepts involving 10s. A small number of students who advance quickly through the majority of lessons also complete Unit 5 (Lessons 67–74), which is a review. Across units, instruction focuses on the types of number knowledge involved in the progression toward arithmetic competence. Instruction incorporates manipulatives and a number list (1–19 through Unit 3; 1–100 for Unit 4), and tutors and students generate stories representing addition and subtraction concepts.
Table 2.
Outline of Galaxy Math Program
| Lesson(s) | Lesson content | Focus of lesson(s) |
|---|---|---|
| 1–5 | Unit 1: Basic number knowledge and symbols number list to 9; counting aloud; reading and writing numbers; number-after knowledge; using hands to show numbers < 10; teens; counting forward and backward; identifying largest and smallest number with number list. | Understanding magnitudes and mapping symbols (words/Arabic numerals) onto their representations; magnitude comparisons; sequencing and number line representations; cardinality principle and counting forwards/backwards/on; part-whole understanding. |
| 6–8 | Comparing numbers with language and symbols; conceptual understanding of addition; meaning of +, =, and bottom line; using correct terminology to show the meaning of adding, | Part–whole understanding; equal sign as a relational symbol. |
| 9–18 | Number-after principle; identity property of zero; adding and subtracting 0, 1, and 2 with number list; conceptual understanding of subtraction; meaning of – (minus sign); using manipulatives, pictures, and actions to solve addition and subtraction problems. | Number-after principle and its relation to ± 1 and ± 2; identity property of zero and its relation to ± 0; commutative property of addition/addend order (and its inapplicability to subtraction); addition and subtraction concepts, inverse relation between adding/subtraction, meaning of subtraction as take away and equalize, and missing addends; verbal and nonverbal adding and subtracting. |
| 19–20 | Unit 2: Doubles doubles with unifix cubes, manipulates and number list; arithmetic doubles number families. | Partitioning number into constituent sets; addition and subtraction concepts; inverse relation between addition/subtraction; meaning of subtraction as take away and equalize and missing addends; number families; verbal and nonverbal addition/subtraction. |
| 21–52 | Unit 3–Sets 5–12: Arithmetic Sets 5–12 (1–4 lessons per set); mastery test to advance to next set; sets with unifix cubes and other manipulatives; number families for each set. | Partitioning number into constituent sets; number families; addition and subtraction concepts; inverse relation between adding/subtracting; meaning of subtraction as take away and equalize and missing addends; commutative property of addition/addend order; verbal and nonverbal addition/subtraction. |
| 53–66 | Unit 4: Tens concepts and place value number list to 100; counting by 10s; 1s and 10s place/place value; meaning of 0 in each place; using rods/cubes to represent 1- and 2-digits; regrouping 10 cubes into 1 rod; identifying smaller and larger numbers using place value and number list; writing and identifying 10s and 1s to represent numerals and rods and cubes. | Magnitude comparisons, sequencing, and number line representations; commutative property of addition/addend order (and its inapplicability to subtraction); addition and subtraction concepts; inverse relation between addition/subtraction; meaning of subtraction as take away and equalize and missing addends; verbal and nonverbal addition and subtraction. |
| 67–74 | Unit 5: Review | Addition and subtraction concepts; inverse relation between addition/subtraction; meaning of subtraction as take away and equalize and missing addends; verbal and nonverbal adding and subtracting; Sets 5–12. |
Unit 3 comprises approximately half the program (not counting the review unit). Unit 3 focuses on partitioning number into constituent sets and number families (e.g., for the 5 set, 0 + 5, 1+ 4, 2 + 3, 5 − 0, 5 − 1, 5 − 2, and so on). Toward this end, five activities are conducted in each lesson. First, the tutor and student use unifix cubes to explore how the target number (e.g., 5 in the 5 Set) can be partitioned in different ways to derive the adding and subtracting problems contained in that set. The second activity also focuses on part–whole knowledge, but with number families (problems using the same three numbers, e.g., 2 + 3 = 5, 3 + 2 = 5, 5 − 2 = 3, and 5 − 3 = 2) in that set. The tutor relies on visual displays that group families in the set and uses blocks to help the student rely on part–whole knowledge to understand how and why four problems make a family. Third, the student generates all addition and subtraction problems (with answers) in the target set, while using rockets to show the problems. Fourth, the tutor and student work together to solve a story problem on that set; they produce the answer and explain why the story problem is specific to the set. Fifth, the student reviews previous sets, orally stating answers to problems and receiving corrective feedback. Between one and four lessons are allocated to each set. After the first lesson in a set, each subsequent lesson begins with a mastery test, with students advancing to the next set if they answer every problem correctly except one in 3 s. After the third lesson, they can partially master the set by answering every flash card correctly except three in 3 s. Students who advance before four lessons per set complete the 12 Set. Others proceed through the 10 Set and then skip to Unit 4 for the sake of content coverage. (In this study, 46% of non-speeded practice students and 43% of speeded practice students received lessons beyond the 10 Set.)
Segment 2: Nonspeeded and speeded practice
The content addressed in the final 5-min segment of tutoring was the same in both conditions, addressing content covered in that day’s number knowledge tutoring lesson: through Lesson 4, number identification, magnitudes, and greater than and less than; after Lesson 4, arithmetic problems (beginning with ± 0, 1, and 2, and moving to Sets 5–12). Activities in the final 5-min segment differed by condition.
In the nonspeeded practice condition, students played games with space-theme manipulatives. Games were designed to provide contextualized review of the content addressed in the day’s lesson. For example, to reinforce n ± 1 lessons, the child used a spinner on a dial segmented from 1 to 19 to identify the number of “rockets called out to explore the math galaxy” and counted this number of rockets onto the board. Then, the tutor informed the child that one more rockets was needed or that one rocket was called back to the space station, so the child added one rocket to the board or took one away. The child then stated the answer and number sentence. For an 8-Set lesson, the child was told how many rockets constituted the fleet and wrote that numeral as the total. The child then rolled a die to find the first group of rockets released from the space station, counted that number of rockets onto the game board, and wrote the numeral as an addend. The child then determined how many more rockets were needed to complete the fleet, wrote that numeral as an addend, and read the number sentence. Next, the child rolled the die to find how many rockets were called back to the space station. The child wrote numerals to generate and read a number sentence. Games differed for each day on the same topic. Throughout nonspeeded practice and lessons, tutors encouraged children to know the answer or to rely on a variety of number-principle strategies including (but not limited to) using number lists, relying on arithmetic principles (e.g., cardinality, commutalivity principle, and inverse relation between addition and subtraction), and efficient counting strategies. “Knowing the answer right off the bat” was the preferred strategy when students were sure of answers.
In the speeded practice condition, students completed the “Meet or Beat Your Score” activity, with which children had 90 s to answer a stack of flash cards. For example, for n ± 1 lessons, flashcards were all n + 1 and 1 + n problems (n = 0–18); for 8 Set lessons, flashcards were all addition problems with the sum 8 and all subtraction problems with the minuend 8. Children answered each problem presented correctly because, as soon as an error occurred, the tutor required the child to use counting to produce the correct response. The 90 s continued to elapse as the child used the counting procedure (as many times as needed). In this way, careful but quick responding increased the number of correct responses, which were counted and charted on the “Rocket Chart” at the end of 90 s. Then, the child had two chances to meet or beat that score. Throughout speeded practice and lessons, tutors required the child to know the answer (i.e., retrieve it from memory, if confident) or use the efficient counting strategies they had been taught. Tutors explained that “knowing the answer right off the bat” was preferred, if the child was sure of the answer.
For addition, children used counting-in: open hand to show the smaller number; say the bigger number (already in hand), and count the smaller number into hand pushing one finger at a time until all fingers are in hand; the answer is the last number counted. For example, for 3 + 4 = 7, hold up 3 fingers, with four fingers down (“in hand”); say 4; count 5 and close one figure into the hand; count 6 and close another finger into the hand; count 7 and close the last linger in the hand; the last number counted, 7, is answer. For subtraction, they used counting-up: close fist, say minus number (number directly after the minus sign), and count up to the minuend, putting up one finger for each count; the answer is the number of fingers up. For example, for 5 – 2 = 3, close hand and say 2; count 3 and raise a finger; count 4 and raise another finger; counts 5 and raise another finger; the answer is 3 because 3 are fingers up.3 The conceptual basis for these counting strategies was addressed in both tutoring conditions. Nonspeeded practice students used these strategies in conjunction with the number list and manipulatives but did not deliberately practice counting strategies.
The key differences between the practice conditions were that one condition was nonspeeded practice and reinforced thoughtful application of the relations and principles that serve as the basis of reasoning strategies to support fact retrieval. The other condition was speeded practice and promoted quick responding and use of efficient counting procedures to generate many correct answers and form long-term representations to support retrieval. Commonalities across nonspeeded and speeded practice were encouragement of strategic behavior and immediate corrective feedback.
Promoting task-oriented behavior
Because at-risk first graders often display attention, motivation, and self-regulation difficulties that may affect learning (e.g., Montague, 2007), we encouraged students to regulate attention and behavior and to work hard. Tutors taught students that on-task behavior (a) means paying attention and trying hard to answer questions or solve the problems correctly and (b) is important for learning math and “blasting off into the math galaxy.” Students had a Galaxy Math Chart for which they earned up to two stickers per session: one after the 25-min number knowledge segment, if the tutor judged the student was on task and worked hard to answer questions correctly. During nonspeeded practice, students earned a second sticker if the tutor judged the student worked hard; during speeded practice, students earned a second sticker if they beat their Rocket Chart score on the second or third round of that day’s Meet or Beat Your Score. Students placed stickers on Galaxy Math Sticker Charts. When they earned enough stickers to reach the sun (between four and six stickers), they chose a small prize (~one prize per week in both conditions).
A small number of students (seven in nonspeeded practice; six in speeded practice) demonstrated challenging behavior despite the Galaxy Math Sticker Chart. For these students, tutors implemented the more highly structured “Moon Map,” with individual rules for appropriate behavior, “gold moon rocks” (instead of stickers), and individual prizes on which the tutor and student agreed. Students earned moon rocks in two ways. First, the tutor set a timer to ring three times per session at varying intervals (i.e., students could not anticipate when to be on task and rule-conformant). When the timer beeped, the tutor awarded a moon rock if the student was on task and conforming to rules at that moment. Second, students earned moon rocks for correct answers (but did not know ahead of time which problems were eligible for earning rocks). Once students earned enough rocks to “land on the moon,” they received a prize.
Training and support for tutors
Across cohorts, 79 individuals were employed full- or part-time as tutors. Part-time employees were master’s- or doctoral-level students, 13% of whom were in teacher licensure programs; another 26% were licensed before their graduate programs. Each tutor worked with between four and seven students distributed equally across the two tutoring conditions.
To promote fidelity, tutors worked from a manual of lesson scripts, which they used to guide their teaching (they were not permitted to read or memorize scripts). Tutors were prepared to use the tutoring program in an initial 2-day workshop and then supported to implement the program in weekly meetings throughout the 16 weeks of tutoring. The initial 2-day workshop provided an overview of the program; explained the focus and rationale of the program; discussed distinctions between the two tutoring conditions and methods to ensure each student received the condition to which he or she had been randomly assigned; modeled key elements of the tutoring procedures; provided practice in implementing those key elements; and explained methods for providing appropriate corrective feedback throughout lessons. After the workshop but prior to the first lesson with a student, tutors completed a reliability quiz covering major components of the tutoring program with 90% accuracy and then demonstrated at least 90% accurate implementation of varying lesson components with a project coordinator.
During implementation, tutors attended weekly meetings, during which each tutor provided an update on each student and discussed learning and behavior challenges and reported problems solved with other tutors, with the two project coordinators and with the first author. At these meetings, key elements of upcoming topics were also reviewed, and upcoming materials were distributed. In addition, every tutoring session was audiotaped. Staff listened to a randomly selected lesson for each tutor in each condition on a weekly basis. The purpose was to identify difficulties with or deviations from the protocol and provide corrective feedback as needed.
Fidelity of Implementation
These audiotapes were also used to quantify fidelity of tutoring implementation. Research assistants independently listened to tapes while completing a checklist to identify the percentage of essential points addressed in that lesson. We sampled 15.62% of tapes such that tutoring conditions, tutors, and lesson types were sampled comparably. Coding agreement exceeded 96%. The mean percentage of points addressed was 97.61 (SD = 2.69) in speeded practice and 97.69 (SD = 2.41) in nonspeeded practice. To assess comparability of fidelity across conditions, we used tutor (n = 79) as the unit of analysis, applying a t test for dependent samples (i.e., tutors worked in both conditions), t(78) = 0.31, p = .755. Fidelity was therefore high and similar across conditions. Also, with the third cohort, we coded the nonspeeded and speeded practice portions of an early and a late tutoring session for number of opportunities to respond to problems: 6.91, SD = 2.81 for nonspeeded practice; 40.32, SD = 16.62 for speeded practice; F(1, 187) = 380.70, p < .001.
Measures: Domain-General Cognitive Resources
Language
The Woodcock Diagnostic Reading Battery (WDRB)–Listening Comprehension (Siegler & Shrager, 1984; Woodcock, 1997) measures the respondent’s ability to understand sentences or passages. Students supply the word missing at the end of 38 sentences or passages that progress from simple verbal analogies and associations to discerning implications. Reliability is .80 at ages 5–18 years.
Nonverbal reasoning
The WASI Matrix Reasoning (Wechsler, 1999) measures nonverbal reasoning with pattern completion, classification, analogy, and serial reasoning tasks. Students complete a matrix, from which one section is missing, from five response options. Reliability is .94; the correlation with the Wechsler Intelligence Scale for Children–III–Full Scale IQ (3rd ed.; Wechsler, 1991) is .66.
Working memory
The Working Memory Test Battery for Children (WMTB–C; Pickering & Gathercole, 2001) comprises nine subtests that assess the central executive, phonological loop, and visuospatial sketchpad. Each subtest has six items at span levels from 1–6 to 1–9. Passing four items at a level moves the child to the next level. At each span level, the number of items to be remembered increases by one. Failing three items terminates the subtest. Subtest order is designed to avoid overtaxing any component area and is generally arranged from easiest to hardest. We used the correct score from the trials. Because the sample of students in this study was considerably larger than the standardization sample at this age, we used z scores based on our sample, as has been done elsewhere (e.g., Geary et al., 2007).
Central executive comprises three dual-task items. For Listening Recall, the child determines if. a sentence is true; after making true/false determinations for a series of sentences, the child recalls the last word of each sentence. For Counting Recall, the child counts a set of four, five, six, or seven dots on a card; after counting a series of cards, the child recalls the number of counted dots of each card. Backward Digit Recall is a standard format backward digit span.
Phonological loop comprises Digit Recall, Word List Recall, and Nonword List Recall, in which the child repeats stimuli spoken by the tester in the same order. In Word List Matching, the tester speaks two words, adding one word at each level. The same words are presented again, and the child determines if the second list is in the same order as the first.
Visuospatial sketchpad comprises two tasks. Block Recall involves a board with nine raised blocks, each with a number on one side, which only the tester sees. The tester taps a block (or series of blocks); the child duplicates the tapping. For Mazes Memory, the tester presents a maze with more than one solution and a picture of an identical maze with a path showing one solution. The picture is removed, and the child duplicates the path.
Processing speed
In the Woodcock–Johnson Reading Battery–III Visual Matching (3rd ed.; Woodcock, McGrew, & Mather, 2001), children locate and circle two identical numbers in rows of six numbers; they have 3 min to complete 60 rows. As per the test developer, reliability is .91.
Attentive behavior
The Strength and Weaknesses of ADHD–Symptoms and Normal-Behavior Scale (SWAN; Swanson et al., 2004) samples items from the Diagnostic and Statistical Manual of Mental Disorders (4th ed.; American Psychiatric Association, 1994) criteria for attention-deficit/hyperactivity disorder for inattention (nine items) and hyperactivity-impulsivity (nine items), but scores are normally distributed. Teachers rate items on a 1–7 scale. We report data for the Inattentive subscale as the average rating across the nine items. The SWAN correlates well with other dimensional assessments of behavior related to attention (Swanson et al., 2004). In the present study, coefficient alpha on the inattentive subscale was .97.
Measures: Strategic Arithmetic Behavior
With Addition Strategy Assessment (Geary et al., 2007), 14 simple addition problems are presented horizontally, one at a time, at the center of a computer screen. Addends are 2 through 9; doubles problems are not used. Half the problems sum to 10 or less, and the smaller addend is in the first position for half the problems. The child is directed to solve each problem (without pencil and paper) as “quickly as possible without making too many mistakes.” The tester emphasizes that the child can use whatever strategy is easiest to get the answer and instructs the child to speak the answer into a microphone that is interfaced with the computer and records response times (RTs). After the child solves each problem, the tester asks the child to describe how he or she derived the answer. On the basis of the child’s description and the experimenter’s observations, the trial is classified in terms of problem-solving strategy; the four most common are counting fingers (uses fingers and/or toes), verbal counting (counts out loud or in head), retrieval (speaks answer quickly without indication of counting; this includes child report of guessing or “I just knew it”), and decomposition (derives answer in steps, without counting). The combination of experimenter observation and child reports collected immediately after solving each problem has proven useful as a measure of children’s strategy choices (Geary, 1990; Geary et al., in press; Siegler, 1987). Validity is supported by RTs associated with each strategy. For example, at second grade, children’s mean RT is 2,789 ms (SD = 1,892) for correct retrieval trials; 4,152 ms (SD = 2784) for decomposition trials; 4,980 ms (SD = 3,928) for verbal counting trials; and 6,662 ms (SD = 4,153) for counting fingers trials (all pairwise comparisons significant; Geary et al., in press). In the present study, we found the same relation between strategy and RT. We used two summary variables: counting errors (number of trials in which a counting strategy was used minus number correct trials in which a counting strategy was used) and reliance on retrieval (number of problems for which retrieval was used correctly).
Measures: Mathematics Performance
Simple arithmetic problems
From the First-Grade Mathematics Assessment Battery (Fuchs, Hamlett, & Powell, 2003), Arithmetic Combinations includes two subtests. Addition comprises 25 addition problems with sums from 5 to 12 (two items have an addend of 1; one has an addend of 0). Subtraction comprises 25 subtraction fact problems with minuends from 5 to 12 (one item has a minuend of 1; one has a minuend of 0). For each subtest, students have 1 min to write answers. Because the pattern of results was similar across subtests, we used total number of correct answers across addition and subtraction. Percentage of agreement, calculated on 20% of protocols by two independent scorers, was 97.8; alpha on this sample was .96.
More complex calculations
From the First-Grade Mathematics Assessment Battery (Fuchs et al., 2003), Double-Digit Addition and Subtraction includes two subtests: addition, with 20 two-digit addition problems with (e.g., 28 + 47) and without (e.g., 20 + 77) regrouping, and subtraction, with 20 two-digit subtraction problems with (e.g., 56 – 19) and without (e.g., 73 – 50) regrouping. For each subtest, students have 5 min to write answers. Because the pattern of results was similar across subtests, we used the total number of correct answers across addition and subtraction. Agreement on 100% of protocols by two independent scorers was 99.7%; alpha on this sample was .94.
Number knowledge: Understanding of number, numeral mapping, and partitioning sets
The Number Sets Test (Geary, Bailey, & Hoard, 2009) indexes the speed and accuracy with which children understand and operate with small numerosities within and just beyond the subitizing range (<10), while transcoding between quantities and their symbols (Arabic numerals). Two types of number-set stimuli are used: objects (circles, squares, diamonds, and stars) in a ½-in. square and an Arabic numeral (18-point font) in a ½-in. square. Stimuli are joined in domino-like rectangles. The two sides of the “domino” are objects/same objects or objects/different objects or Arabic numerals/Arabic numerals or objects/Arabic numerals. Each line of the page shows 5 two-square dominos, but the last two lines show 3 three-square dominos. At the top of the page, the target sum (5 or 9) shows in larger font (36 points); the digits 5 and 9 were chosen because they represent smaller and larger values within the range of basic Arabic numerals (i.e., from 1 to 9). The first page for each target contains objects/same objects and objects/different objects; the second page, objects/Arabic numerals and Arabic numerals/Arabic numerals. On each page, 18 items match the target; 12 are larger than the target; six are smaller than the target; and six contain 0 or an empty square. The tester explains two items matching the Target 4 and, then, uses the Target 3 to familiarize children further with the task. The measure is then administered. The child is told to move across each line of the page from left to right without skipping any; to “circle any groups that can be put together to make the top number, 5 [9]”; and to “work as fast as you can without making many mistakes.” The child has 60 s per page for the target sum of 5 and 90 s per page for the target sum of 9 (time limits were chosen to avoid ceiling effects and to assess fluent recognition of quantities).
Signal detection methods are applied to the number of hits and false alarms to generate a d′ variable representing the child’s sensitivity to quantities (Geary et al., 2009; MacMillan, 2002). Children who correctly identify many target quantities and commit few false alarms have high scores; those who have as many hits as false alarms have low scores, in which case the high number of correct items is due to the bias to respond, not sensitivity to quantity. The processes underlying variation in d′ scores are not yet fully understood but may include a combination of basic numerical processes and representations that have been the focus of intense study and debate (e.g., De Smedt et al., 2009; Holloway & Ansari, 2009; Iuculano, Tang, Hall, & Butterworth, 2008; Rousselle & Noël, 2007). Individual differences on d′ are likely related to (a) acuity of the cognitive systems for representing exact small quantities or approximate larger ones (Koontz & Berch, 1996; Price, Hoiloway, Räsänen, Vesterinen, & Ansari, 2007); (b) ease of mapping of Arabic numerals onto the underlying representation of magnitude (e.g., De Smedt & Gilmore, 2011; Landerl & Kölle, 2009; Rousselle & Noël, 2007); (c) implicit or explicit understanding of addition (Jordan, Huttenlocher, & Levine, 1992; Levine, Jordan, & Huttenlocher, 1992); and (d) numerosity coding (Butterworth, 2010; i.e., understanding of cardinal value and the concept that numbers are composed of sets of smaller-magnitude numbers). Controlling for general cognitive ability, working memory, and processing speed, first-grade d′ predicts individual differences in school mathematics but not in reading achievement (Geary, 2011), and school-entry mathematics deficits of children with mathematics disability are fully mediated by d′, which in turn partially mediates slow growth in mathematics but not in reading through fifth grade (Geary et al., 2012).
Word problems
Word Problems (Jordan & Hanich, 2000) is a measure that comprises 14 word problems representing the predominant word-problem types in the primary grades: combine (two quantities are combined to form a total), compare (two quantities are compared to find a difference), or change (an action that triggers an increase or decrease). Problems require simple arithmetic for solution. The tester reads each item aloud; students have 30 s to write an answer and can ask for rereading(s) as needed. The score is the number of correct answers. A second scorer independently rescored 20% of protocols, with agreement of 99.7. Alpha on this sample was .86.
Procedure
In September, we screened students for study entry. In September and October, we administered (a) measures of domain-general cognitive resources and the Addition Strategy Assessment individually and (b) measures of mathematics in small groups. In November, teachers completed the SWAN. Tutoring began in late October and continued into March. After tutoring ended, we administered the Addition Strategy Assessment individually and mathematics measures in small groups. All test sessions were audiotaped; 15% of tapes were randomly selected, stratifying by tester, for accuracy checks by an independent scorer. Agreement exceeded 99%. Testers were blind to study condition when administering and scoring tests.
Results
We conducted four types of preliminary analyses. First, we assessed pretest comparability as a function of study condition. In all cases, prior to intervention, performance of low-risk students exceeded that of students in each of the at-risk conditions, but the at-risk groups were comparable (see Tables 3 and 4). Second, we estimated the proportion of variance in mathematics outcome measures that was due to differences in classroom instruction, using SAS PROC MIXED (Littell, Stroup, Wolfinger, & Schabenberger, 2006)—15 (p < .001), 24 (p < .001), 4 (p < .001), and 6 (p = .019) in simple arithmetic, more complex calculations, number knowledge, and word problems, respectively. Thus, we included classroom as a random effect in each model (except pretest comparability analyses, for which classroom effects are not relevant). Because the purpose of including classroom nesting in the models was to control for its effect, not to interpret it, we do not report variance components. Third, because we relied on a residualized change approach to analyze effects of study condition (i.e., covarying pretest performance to reduce within-group error variance), we assessed the homogeneity of regression assumption, which was met for all measures except simple arithmetic, F(3, 686) = 5.38, p = .001. We therefore controlled for the interaction between pretest simple arithmetic scores and condition by including it in models involving that measure. As with the nesting variable, because our goal was to control this effect, not to interpret it, we do not report it. Finally, we assessed the role of study cohort by examining interactions between study condition and cohort. None was identified so we excluded cohort from the models.
Table 3.
No-Tutoring Control Condition: Raw Score Pretest Means (and Standard Deviations), Posttest Means (and Standard Deviations) for Outcomes, Standard Scores (and Standard Deviations) for Predictors, and Least Squares Means (and Standard Errors) for Outcomes
| Variable | Not-at-risk no-tutoring control (n = 300)
|
At-risk no-tutoring control (n = 206)
|
||||||||||
|---|---|---|---|---|---|---|---|---|---|---|---|---|
| Pretest
|
Posttest or standarda
|
Least square mean
|
Pretest
|
Posttest or standarda
|
Least squares mean
|
|||||||
| M | SD | M | SD | M | SE | M | SD | M | SD | M | SE | |
| Predictor | ||||||||||||
| Processing speed | 10.04 | 2.41 | 101.61 | 14.30 | 7.12 | 2.97 | 86.45 | 21.71 | ||||
| Working memory | ||||||||||||
| Phonological | 19.50 | 3.96 | 0.62 | 0.84 | 15.14 | 4.43 | −0.31 | 0.94 | ||||
| Visual spatial | 13.01 | 3.39 | 0.64 | 0.93 | 9.33 | 3.12 | −0.37 | 0.86 | ||||
| Central executive | 9.52 | 2.89 | 0.83 | 0.85 | 5.28 | 2.69 | −0.41 | 0.79 | ||||
| Attentive behavior | 46.93 | 11.05 | 31.37 | 9.99 | ||||||||
| Listening comprehension | 20.73 | 5.95 | 46.50 | 9.70 | 14.43 | 5.30 | 36.91 | 8.22 | ||||
| Nonverbal reasoning | 11.55 | 5.79 | 53.52 | 10.13 | 5.90 | 3.21 | 44.50 | 6.29 | ||||
| Outcome measure | ||||||||||||
| Simple Arithmetic | 29.94 | 11.86 | 42.79 | 14.13 | 34.07 | 0.85 | 12.50 | 7.38 | 22.18 | 11.73 | 28.55 | 0.92 |
| Complex Calculations | 3.68 | 3.26 | 7.06 | 4.93 | 5.33 | 0.25 | 0.42 | 0.93 | 1.94 | 2.88 | 2.95 | 0.26 |
| Number Knowledge | 1.03 | 1.03 | 1.10 | 1.06 | 0.28 | 0.07 | −0.51 | 0.73 | −0.77 | 1.22 | −0.33 | 0.08 |
| Word Problems | 5.64 | 3.16 | 8.41 | 3.57 | 6.55 | 0.16 | 1.72 | 1.79 | 2.75 | 2.28 | 3.74 | 0.17 |
| Addition Strategy | ||||||||||||
| Counting Errors | 2.49 | 2.51 | 1.97 | 1.50 | 1.42 | 0.16 | 4.91 | 4.28 | 3.75 | 3.33 | 3.61 | 0.19 |
| Retrieval | 2.08 | 2.81 | 4.32 | 3.61 | 3.60 | 0.18 | 0.36 | 0.88 | 1.49 | 2.13 | 1.85 | 0.20 |
For predictors, scores are standard scores, expressed as M = 100 and SD = 15 for processing speed, M = 0.00 and SD = 1.00 for working memory measures, and M = 50 and SD = 10 for listening comprehension and nonverbal reasoning. Outcome scores are raw scores.
Table 4.
At-Risk Groups: Raw Score Pretest Means (and Standard Deviations), Posttest Means (and Standard Deviations) for Outcomes, Standard Scores (and Standard Deviations) for Predictors, and Least Squares Means (and Standard Errors) for Outcomes
| Variable | At-risk number knowledge + speeded practice tutoring (n = 195)
|
At-risk number knowledge + nonspeeded practice tutoring (n = 190)
|
||||||||||
|---|---|---|---|---|---|---|---|---|---|---|---|---|
| Pretest
|
Posttest or standarda
|
Least squares mean
|
Pretest
|
Posttest or standarda
|
Least squares mean
|
|||||||
| M | SD | M | SD | M | SE | M | SD | M | SD | M | SE | |
| Predictor | ||||||||||||
| Processing speed | 6.94 | 2.76 | 85.55 | 20.02 | 7.39 | 2.58 | 89.09 | 19.09 | ||||
| Working memory | ||||||||||||
| Phonological | 15.28 | 4.45 | −0.28 | 0.95 | 15.23 | 4.48 | −0.29 | 0.95 | ||||
| Visual spatial | 9.88 | 3.24 | −0.22 | 0.89 | 9.47 | 3.29 | −0.34 | 0.90 | ||||
| Central executive | 5.19 | 2.61 | −0.44 | 0.77 | 5.49 | 2.96 | −0.35 | 0.87 | ||||
| Attentive behavior | 31.56 | 10.54 | 31.72 | 11.71 | ||||||||
| Listening comprehension | 14.32 | 5.77 | 36.73 | 8.85 | 14.40 | 5.83 | 37.11 | 9.10 | ||||
| Nonverbal reasoning | 6.08 | 3.57 | 44.86 | 6.54 | 5.54 | 3.25 | 43.90 | 6.33 | ||||
| Outcome measure | ||||||||||||
| Simple Arithmetic | 12.53 | 7.61 | 33.43 | 13.89 | 39.65 | 0.93 | 12.38 | 6.75 | 27.84 | 11.76 | 33.03 | 0.97 |
| Complex Calculations | 0.47 | 1.10 | 4.21 | 3.85 | 5.26 | 0.27 | 0.39 | 0.87 | 3.58 | 3.35 | 4.49 | 0.27 |
| Number Knowledge | −0.50 | 0.66 | −0.36 | 1.34 | 0.04 | 0.07 | −0.05 | 0.66 | −0.50 | 1.20 | −0.10 | 0.07 |
| Word Problems | 1.77 | 1.57 | 3.33 | 2.42 | 4.26 | 0.17 | 1.81 | 1.84 | 3.50 | 2.48 | 4.37 | 0.17 |
| Addition Strategy | ||||||||||||
| Counting Errors | 4.92 | 4.03 | 2.82 | 3.08 | 2.72 | 0.19 | 4.77 | 3.97 | 3.15 | 3.09 | 3.08 | 0.19 |
| Retrieval | 0.50 | 1.12 | 2.97 | 3.11 | 3.21 | 0.20 | 0.30 | 0.78 | 2.45 | 2.76 | 2.87 | 0.20 |
For predictors, scores are standard scores, expressed as M = 100 and SD = 15 for processing speed, M = 0.00 and SD = 1.00 for working memory measures, and M = 50 and SD = 10 for listening comprehension and nonverbal reasoning. Outcome scores are raw scores.
Tutoring Efficacy: Effects on Simple Arithmetic and Other Mathematics Outcomes
For each outcome, a two-level residualized change approach was used to analyze effects of study condition: Students were nested in classrooms, and pretest performance was used as a covariate along with the main effect of study condition to predict posttest performance. To follow up significant effects, we conducted pairwise post hoc contrasts comparing the least squares mean differences among study conditions, controlling for pretest scores. We corrected for false discovery rate (i.e., expected proportion of all rejected null hypotheses rejected erroneously) as per Benjamini and Hochberg (1995) and report when p values < .05 failed to meet the correction cut points. To compute effect sizes (ESs), we subtracted the difference between least squares means and divided the difference by the unadjusted posttest pooled standard deviation. See Tables 3 and 4 for raw score pretest and posttest means and standard deviations (SDs) and posttest least squares means and standard errors. See Table 5 for inferential statistics and ESs. Readers should note that we use learning, improvement, and performance to refer to posttest performance controlled for covariates, including pretest scores.
Table 5.
Effects on Mathematics Outcomes
| Variable | Simple Arithmetic
|
Complex Calculations
|
Number Knowledge
|
Word Problems
|
||||||||
|---|---|---|---|---|---|---|---|---|---|---|---|---|
| F or t | p | ES | F or t | p | ES | F or t | p | ES | F or t | p | ES | |
| Effect of condition | 12.27 | <.001 | na | 22.93 | <.001 | na | 12.06 | <.001 | na | 49.66 | <.001 | na |
| Follow-up tests | ||||||||||||
| Speeded vs. no tutoring | 8.94 | <.001 | .87 | 7.23 | <.001 | .69 | 3.88 | <.001 | .29 | 2.32 | .021 | .22 |
| Nonspeeded vs. no tutoring | 3.53 | <.001 | .38 | 4.84 | <.001 | .49 | 2.44 | 0.15 | .19 | 2.80 | .005 | .27 |
| Speeded vs. nonspeeded | 5.21 | <.001 | .51 | 2.40 | .017 | .21 | 1.41 | .159 | .11 | 0.47 | .642 | .04 |
| Speeded vs. low-risk | 4.67 | <.001 | .39 | 0.19 | .849 | −.01 | 2.21 | .028 | −.20 | 9.39 | <.001 | −.73 |
| Nonspeeded vs. low-risk | 0.84 | .401 | −.07 | 2.41 | .016 | .19 | 3.50 | <.001 | -−.33 | 8.97 | <.001 | −.69 |
| No-tutoring vs. low-risk | 4.63 | <.001 | −.42 | 6.91 | <.001 | −.57 | 5.79 | <.001 | −.53 | 11.61 | <.001 | −.92 |
Note. Effect of condition is F value (df = 3,351 for Simple Arithmetic; 3,354 for other measures). Follow-up tests are t values (df = 351 for Simple Arithmetic; 354 for other measures). Low-risk is low-risk control; speeded is number knowledge tutoring + speeded practice; nonspeeded is number knowledge tutoring + nonspeeded practice; no tutoring is at-risk no-tutoring control. ES = effect size; na = not applicable.
With the effects of classroom variance, pretest arithmetic performance, and the interaction between pretest arithmetic scores and treatment controlled, the effect of condition was significant for all four mathematics outcomes. Follow-up tests indicated the following. For simple arithmetic, children in each tutoring condition exceeded students in the at-risk no-tutoring group. However, the speeded practice tutoring group outperformed the nonspeeded practice group. Moreover, the speeded group narrowed the achievement gap with respect to low-risk classmates, whereas students in the nonspeeded group did not, and students in the at-risk no-tutoring group lost substantial ground. (ΔS > ΔLR = ΔN > ΔNT, where Δ is residualized change; S is speeded practice, LR is low-risk control, N is nonspeeded practice, and NT is at-risk no-tutoring control.) In terms of more complex calculations, children in each tutoring group again exceeded students in the at-risk no-tutoring group, but the speeded tutoring group outperformed the nonspeeded group. Moreover, although the speeded group did not narrow the achievement gap with respect to low-risk classmates, the gap increased for the nonspeeded group and the at-risk no-tutoring group. (ΔLR = ΔS > ΔN > ΔNT.) For number knowledge and for word problems, children in each tutoring group exceeded students in the at-risk no-tutoring group, and learning in the two tutoring conditions was comparable. Students in each of the three at-risk groups lost ground with respect to low-risk classmates. (ΔLR > ΔS = ΔN > ΔNT.)
Processes by Which Tutoring Affects Development
Children’s strategic behavior when solving simple arithmetic problems
Raw score pretest and posttest means and SDs and posttest least squares means and standard errors are shown in Tables 3 and 4, and associated inferential statistics and ESs in Table 6. With effects of classroom variance and pretest counting errors controlled, the effect of condition was significant for counting errors and retrieval. Follow-up tests indicated the following: For counting errors, the speeded condition improved more than the at-risk no-tutoring group, but nonspeeded practice students did not. Even so, improvement for the two tutoring groups was comparable. The achievement gap with respect to low-risk classmates grew for each of the three at-risk groups. (ΔLR < ΔS = ΔN; ΔLR < ΔNT; ΔS < ΔNR but ΔN = ΔNT; low scores reflect greater competence.) For retrieval, each tutoring group improved more than the at-risk no-tutoring group, but improvement in the two tutoring conditions was comparable. Even so, the speeded practice group kept pace with the low-risk control classmates, whereas children in the nonspeeded practice condition and in the at-risk no-tutoring condition lost ground. (ΔLR = ΔS; LR > ΔN; ΔLR > ΔNT; ΔS = ΔN > ΔNT.)
Table 6.
Effects on Strategic Behavior When Solving Arithmetic Problems
| Variable | Counting errors
|
Retrieval
|
||||
|---|---|---|---|---|---|---|
| F or t | p | ES | F or t | p | ES | |
| Effect of condition | 29.53 | <.001 | na | 16.63 | <.001 | na |
| Follow-up tests | ||||||
| Speeded vs. no tutoring | 3.39 | <.001 | .28 | 5.13 | <.001 | .52 |
| Nonspeeded vs. no tutoring | 2.02 | .004a | .17 | 3.83 | <.001 | .42 |
| Speeded vs. nonspeeded | 1.34 | .180 | .12 | 1.28 | .200 | .12 |
| Speeded vs. low-risk | 5.31 | <.001 | −.61 | 1.47 | .142 | −.11 |
| Nonspeeded vs. low-risk | 6.61 | <.001 | −.77 | 2.77 | .006 | −.22 |
| No tutoring vs. low-risk | 8.91 | <.001 | −.98 | 6.78 | <.001 | −.59 |
Note. Effect of condition is F value (df = 3,351). Follow-up tests are t values (df = 354). Low-risk is low-risk control; speeded is number knowledge tutoring + speeded practice; nonspeeded is number knowledge tutoring + nonspeeded practice; no tutoring is at-risk no-tutoring control. ES = effect size; na = not applicable.
Failed to meet correction cutoff point.
We also explored how improvement in counting errors and retrieval contributed to the effects of tutoring on simple arithmetic. With effects of classroom variance, the interaction between pretest simple arithmetic and study condition, pretest counting errors scores, pretest retrieval scores, improvement in counting errors, and improvement in retrieval in the model, the effect for study condition remained significant, F(3, 348) = 9.48, p < .001. The pattern of effects on arithmetic learning was unchanged,4 and decreases in counting errors played a role in arithmetic learning, F(1, 348) = 4.64, p = .032, as did increases in retrieval, F(1, 348) = 75.58, p < .001. Following Preacher and Hayes (2008), we then conducted multiple mediation analysis to examine whether reduction in counting errors or increase in retrieval was causally involved in (mediated) the effects of tutoring on arithmetic, using a path analytical framework for estimating direct and indirect effects. (We multiplied counting errors by −1 so that higher scores represent decreases in counting errors.) Figure 1 shows the model contrasting nonspeeded practice against at-risk control in the top panel and the model contrasting speeded practice against at-risk control in the bottom panel5 (path coefficients and standard errors6 are along the arrows). The total effect of nonspeeded practice versus at-risk control on arithmetic was 2.79, SE 0.47, t = 5.95, p < .001. The mediation model partitioned this total effect into direct and indirect effects. The direct effect of nonspeeded practice remained significant, with a coefficient of 2.08 (a 25% reduction from the total effect) and indirect effects totaled 0.71. The portion of indirect effects attributable to improvement in counting errors was not significant, 0.07, SE 0.07, Z = 0.94, p = .348, but improvement in retrieval was a significant mediator, 0.64, SE 0.18, Z = 3.57, p < .001. The total effect of speeded practice versus at-risk control on arithmetic was 5.57, SE 0.49, t = 11.27, p < .001. The direct effect of study condition on arithmetic remained significant, with a coefficient of 4.67 (a 16% reduction from the total effect) and indirect effects totaled 0.90. Again, the portion of indirect effects attributable to improvement in counting errors was not significant, 0.08, SE 0.07, Z = 1.18, p = .237, but improvement in retrieval was a significant mediator, 0.83, SE 0.20, Z = 4.08, p < .001.
Figure 1.
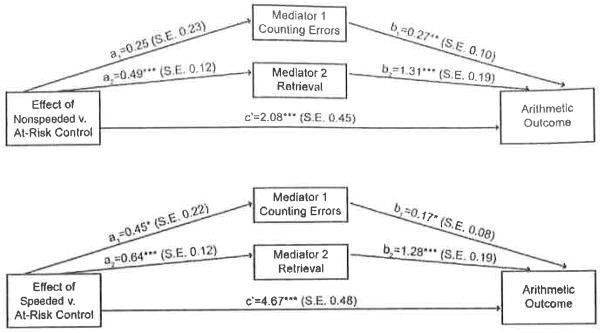
Mediation of counting errors and retrieval in the effects of study condition on simple arithmetic. S.E. = standard error.
Contribution of pretest cognitive resources
Using multilevel regression analyses (i.e., controlling for classroom nesting), we tested the contribution of pretest cognitive resources and their interactions with study condition on improvement in simple arithmetic and word problems. For each outcome, we began with a series of preliminary analyses, testing the interaction between condition and each predictor separately (with classroom and pretest performance controlled in the models) and trimmed nonsignificant interactions from the final models. See Table 7 for zero-order correlations.
Table 7.
Correlations Among Study Variables (n = 891)
| Variable | Correlations
|
|||||||||||||||||
|---|---|---|---|---|---|---|---|---|---|---|---|---|---|---|---|---|---|---|
| PS | PL | VS | CE | A | L | NR | AR1 | AR2 | CC1 | CC2 | NK1 | NK2 | WP1 | WP2 | E1 | E2 | R1 | |
| Cognitive resources | ||||||||||||||||||
| Processing speed (PS) | ||||||||||||||||||
| Phonological loop (PL) | .36 | |||||||||||||||||
| Visual-spatial (VS) | .44 | .38 | ||||||||||||||||
| Central executive (CE) | .48 | .56 | .56 | |||||||||||||||
| Attentive behavior (A) | .43 | .39 | .42 | .54 | ||||||||||||||
| Listening comprehension (L) | .42 | .48 | .38 | .57 | .46 | |||||||||||||
| Nonverbal reasoning (NR) | .40 | .34 | .39 | .45 | .38 | .38 | ||||||||||||
| Mathematics | ||||||||||||||||||
| Arithmetic–Pre (AR1) | .51 | .42 | .51 | .61 | .57 | .50 | .48 | |||||||||||
| Arithmetic–Post (AR2) | .41 | .34 | .41 | .49 | .45 | .36 | .38 | .70 | ||||||||||
| Complex Calculations–Pre (CC1) | .39 | .36 | .44 | .50 | .47 | .46 | .45 | .75 | .54 | |||||||||
| Complex Calculations–Post (CC2) | .36 | .27 | .37 | .45 | .39 | .31 | .36 | .59 | .72 | .56 | ||||||||
| Number Knowledge–Pre (NK1) | .51 | .45 | .50 | .63 | .55 | .53 | .49 | .79 | .62 | .69 | .53 | |||||||
| Number Knowledge–Post (NK2) | .50 | .39 | .50 | .62 | .50 | .51 | .48 | .68 | .70 | .56 | .60 | .71 | ||||||
| Word Problems–Pre (WP1) | .43 | .42 | .45 | .61 | .50 | .55 | .51 | .68 | .52 | .64 | .46 | .67 | .57 | |||||
| Word Problems–Post (WP2) | .45 | .43 | .47 | .62 | .55 | .59 | .56 | .67 | .60 | .60 | .53 | .68 | .64 | .75 | ||||
| Counting Error–Pre (E1) | −.08 | −.12 | −.13 | −.16 | −.12 | −.13 | −.19 | −.28 | −.21 | −.27 | −.20 | −.30 | −.19 | −.28 | −.27 | |||
| Counting Error–Post (E2) | −.30 | −.20 | −.28 | −.34 | −.23 | −.28 | −.33 | −.40 | −.46 | −.31 | −.35 | −.40 | −.42 | −.35 | .38 | .28 | ||
| Retrieval–Pre (R1) | .21 | .24 | .27 | .31 | .27 | .26 | .30 | .51 | .51 | .50 | .39 | .52 | .42 | .43 | .44 | −.32 | −.24 | |
| Retrieval–Post (R2) | .23 | .19 | .24 | .30 | .23 | .20 | .26 | .42 | .42 | .33 | .44 | .40 | .46 | .31 | .37 | −.21 | −.45 | .46 |
Note. Pre = pretest; post = posttest.
In predicting improvement on simple arithmetic, preliminary analyses indicated an interaction between nonverbal reasoning and condition. The final model therefore controlled for classroom nesting, pretest arithmetic performance, and the interaction between condition and pretest arithmetic scores, as we assessed the effect of each cognitive resource and the interaction between condition and nonverbal reasoning. Across study conditions, attentive behavior, B = 1.08, SE 0.44, t(649) = 2.45, p = .015, β = .07, and central executive working memory, B = 1.53, SE 0.64, t(649) = 2.40, p = .017, β = .08, predicted posttest scores. The interaction between nonverbal reasoning and study condition remained significant in this larger model. Follow-up tests revealed the regression slope for nonspeeded practice (while holding effects of other variables in the model constant) was significantly steeper than for low-risk, t(649) = 2.71, p = .007, and control, t(649) = 2.54, p = .010, groups. Although the regression slopes of the two tutored groups were comparable, t(649) = 1.25, p = .212, the slope for speeded practice was not significantly different from low-risk and control students. This interaction is illustrated in Figure 2, Panel A, which shows improvement on arithmetic for each study condition, as a function of students’ pretest nonverbal reasoning (i.e., 1 SD below mean, at mean, and 1 SD above mean).
Figure 2.

Adjusted posttest scores by study condition as a function of pretest cognitive resource. Arithmetic posttest scores are controlled for classroom nesting, pretest arithmetic performance, the interaction between condition and pretest arithmetic scores, and the effect of each of the cognitive resources. Word-problem posttest scores are controlled for classroom nesting, pretest number word-problem performance, the effect of each of the cognitive resources, and posttest arithmetic scores (to assess effects on word problems beyond the effect of adding or subtracting numbers correctly in word problems).
In predicting improvement on word problems, preliminary analyses revealed two significant interactions with study condition: one involving attentive behavior and the other listening comprehension. Final models therefore controlled for classroom nesting, pretest number word-problem performance, and posttest simple arithmetic scores (to assess effects on word problems beyond the effect of adding or subtracting numbers correctly in word problems), as we assessed the effect of each cognitive resource and one of the interactions.
For the interaction between attentive behavior and study condition, the effect of pretest word-problem performance was significant, B = 0.44, SE 0.04, t(651) = 12.16, p < .001, (β = .42, as was posttest simple arithmetic performance, B = 0.04, SE 0.01, t(651) = 7.17, p < .001, β = .20, listening comprehension, B = 0.53, SE 0.11, t(651) = 4.98, p < .001, (β = .15, executive control working memory, B = 0.32, SE 0.14, t(651) = 2.31, p = .021, β = .08, nonverbal reasoning, B = 0.51, SE 0.09, t(651) = 5.89, p < .001, β = .13, and attentive behavior, B = 0.63, SE 0.15, t(651) = 4.28, p < .001, β = .21. The effect of attentive behavior was superseded by the significant interaction between attentive behavior and condition (which remained significant in the larger model). As in Figure 2 (Panel B), the regression slope for low-risk students (while holding effects of other variables in the model constant) was significantly steeper than for nonspeeded practice, t(651) = 3.01, p = .003, and practice, t(651) = 2.33, p = .020, but comparable to control, t(651) = 1.43, p = .153.
For the interaction between listening comprehension and condition, the effect of pretest word-problem performance was significant, B = 0.44, SE 0.04, t(651) = 11.93, p < .001, β = .42, as was posttest simple arithmetic performance, B = 0.05, SE 0.01, t(651) = 7.73, p < .001, β = .25, nonverbal reasoning, B = 0.48, SE 0.09, t(651) = 5.52, p < .001, β = .13, central executive working memory, B = 0.37, SE 0.14, t(651) = 2.70, p = .007, β = .10, and listening comprehension, B = 0.89, SE 0.18, t(651) = 5.03, p < .001, β = .26. The effect of listening comprehension was superseded by the significant interaction between listening comprehension and condition (which remained significant in the larger model). As in Figure 2 (Panel C), the regression slope for low-risk students (while holding the effects of other variables in the model constant) was significantly steeper than for practice, t(651) = 2.74, p = .006, but comparable to nonspeeded practice, t(651) = 1.33, p = .185, and control, t(651) = 1.74, p = .082.
Discussion
Simple arithmetic is a core mathematical competence, representing a critical intervention target for first-grade children at risk for poor long-term mathematics learning. Competence with simple arithmetic is a significant path to higher level mathematics performance (e.g., Fuchs, Fuchs, Compton, et al., 2006); arithmetic fluency may be a signature deficit of mathematics learning disability (e.g., Geary et al., 2012; Goldman et al., 1988; Jordan et al., 2003); and remediating arithmetic deficits in older students can be difficult (Fuchs, Powell, et al., 2010). This indicates the need for early prevention. In the present study, we investigated the effects of first-grade number knowledge tutoring with contrasting forms of practice on at-risk learners’ emerging competence with arithmetic. One practice condition was non-speeded and encouraged a variety of number-principle strategies; the other was speeded and encouraged efficient counting strategies. We also assessed effects on more complex calculations, number knowledge, and word problems and examined processes by which effects occurred. In this discussion, we use the terms learning, improvement, responsiveness, and outcomes to refer to the residualized change approach we used to assess effects.
Simple Arithmetic
In terms of fluency with simple arithmetic, number knowledge tutoring with nonspeeded practice produced significantly better learning compared with at-risk control students who did not receive tutoring. The ES was .38. Nonspeeded practice was designed to reinforce the relations and principles that were emphasized in the number knowledge portion of tutoring and that serve as the basis of reasoning strategies to support arithmetic skill. Findings lend theoretical support to studies indicating the important role number knowledge plays in development of competence with simple arithmetic. Earlier work includes descriptive studies, which show that generating many correct responses, as in speeded practice, does not fully explain changes in error patterns and acquisition of correct answers in simple arithmetic (Baroody, 1988, 1999). The descriptive literature also includes correlational studies showing core numerical processes uniquely account for variance in learning arithmetic skill (e.g., De Smedt et al., 2009; Duncan et al., 2007; Rousselle & Noel, 2007) and causal-comparative studies showing children with mathematics disability have number-sense deficits (Butterworth & Reigosa, 2007; Koontz & Berch, 1996).
At the same time, nonspeeded practice did not help at-risk students narrow the achievement gap with respect to low-risk classmates (ES = .07 favoring low-risk classmates). By contrast, incorporating speeded practice in number knowledge tutoring produced superior improvement in simple arithmetic in at-risk students compared with low-risk classmates, with an ES of .39, thereby narrowing the achievement gap. Speeded practice was also substantially more effective than number knowledge tutoring with nonspeeded practice (ES = .51) and produced an ES of .87 over at-risk control. In this way, the present study extends earlier randomized control trials by isolating the effects of speeded practice, delivered in the context of tutoring to build number knowledge. Results indicate a substantial role for speeded practice in promoting simple arithmetic learning. We note that in contrast to how practice is sometimes configured in schools (i.e., without sufficient scaffolding in number knowledge, in massed doses, and without support for correct responding), we delivered speeded practice in the context of number knowledge instruction and formulated practice to help children generate many correct responses, supported development of fluency with efficient counting strategies, required students to immediately correct errors with an efficient counting procedure, and encouraged strategic meta-cognitive behavior (i.e., requiring children to retrieve answers from memory, if confident; otherwise, to use an efficient counting strategy). Therefore, findings should be generalized only to speeded practice that incorporates similarly sound, theoretically motivated instructional design.
We were also interested in how such effects occurred. Because the number knowledge portion of tutoring in both conditions addressed the relations and principles that support sophisticated counting strategies and retrieval, we expected both tutoring conditions to increase proficiency with counting and reliance on retrieval more than at-risk control students. Because speeded practice generated many more correct responses than nonspeeded practice (40:7 correct responses per session), by requiring fast execution of efficient counting strategies, we expected speeded practice to exceed nonspeeded practice in terms of retrieval as well as proficiency with counting strategies. Although mean differences favored speeded over nonspeeded practice on retrieval and counting strategies (ESs from .11 to .12), these differences were not statistically significant. The pattern of effects did suggest some advantage for speeded practice: On counting errors, speeded practice improved more than at-risk control (ES = .28), but non-speeded practice did not; on retrieval, improvement was comparable for speeded-practice students and low-risk classmates, but nonspeeded-practice students improved less than low-risk classmates (ES = .22). In considering the lack of clarity in these effects on problem-solving strategies, readers should consider the challenges of coding strategic behavior based on children’s self-reports and tester observations.
Aside from the issue of whether effects were stronger for one tutoring condition over the other on counting errors or retrieval, analyses revealed that children’s strategic behavior played a similar role in mediating the effects of both tutoring conditions on arithmetic outcomes: Decreases in counting errors did not mediate the effects tutoring compared with at-risk control; increases in retrieval mediated effects such that tutoring improved reliance on retrieval, which in turn improved arithmetic competence. This mediation effect was, however, partial. So both tutoring conditions also affected arithmetic performance beyond effects that accrued via increased reliance on retrieval.
To gain additional insight into die processes by which the two forms of tutoring affected simple arithmetic learning, we examined the role of domain-general cognitive resources in the context of intervention. Our hypothesis was that speeded practice helps at-risk children circumvent limitations in the cognitive resources associated with arithmetic development. In predicting arithmetic learning (while considering effects of the other cognitive resources and controlling for the amount and quality of classroom instruction, pretest arithmetic scores, and the interaction between condition and pretest arithmetic scores), the effects of two cognitive resources were important: Regardless of condition, stronger attentive behavior (β = .07) and higher central executive working memory span (β = .08) improved responsiveness to intervention, while weaker competence in these cognitive resources decreased responsiveness. This provides strong support for the role of attentive behavior and working memory in arithmetic development, corroborating prior studies with effects of similar magnitude (e.g., Fuchs et al., 2005; Geary et al., 2012; in press). It also indicates that tutoring did not modify the importance of these two cognitive resources in determining learning.
By contrast, nonverbal reasoning did moderate the effects of study condition on arithmetic learning. This interaction is illustrated in Figure 2, Panel A (in which arithmetic outcomes are controlled for the multiple effects in the model). As shown, individual differences in nonverbal reasoning played a more important role in determining responsiveness for nonspeeded-practice students than for speeded-practice, at-risk control, or low-risk classmates. That is, at-risk children in the nonspeeded practice condition, with low pretest reasoning ability, suffer relatively poor response compared with the responses of medium- and high-ability peers in the same condition. By contrast, the effects of speeded practice are less dependent on children’s reasoning ability, as reflected in the highest path in Figure 2 (Panel A). This path also dramatically shows how the responsiveness of speeded practice students, with low, medium, or high pretest reasoning ability, is superior to nonspeeded-practice, low-risk, or at-risk control students with high pretest reasoning scores. So, in line with Geary, Boykin, et al. (2008), speeded practice appears to help at-risk students compensate for weak reasoning ability.
Related Forms of Mathematics Learning
Although findings suggest the value of speeded practice in supporting at-risk children’s development of arithmetic competence, they do not address the possibility that speeded practice, with its focus on rote responding, is detrimental to other forms of mathematics learning. We investigated this possibility by assessing complex calculations, number knowledge, and word problems and found no evidence to support such a hypothesis. In fact, on complex calculations, speeded practice combined with number knowledge tutoring produced stronger learning than number knowledge tutoring with nonspeeded practice (ES = .21) or in at-risk control condition (ES = .69). This was the case even though Unit 4’s focus on multidigit number knowledge was identical in the speeded and nonspeeded practice conditions. Moreover, improvement on complex calculations was comparable for speeded practice students and their low-risk classmates (ES = .01), even as improvement on more complex calculations for low-risk students exceeded that of nonspeeded practice. students (ES = .19) and at-risk control students (ES = .57).
It is important to note, however, that effects on number knowledge or word-problem learning did not favor the speeded practice condition—although there was no indication that speeded practice was detrimental to these forms of mathematics learning. On number knowledge, the tutored groups developed comparably (ES = .11, favoring speeded practice) and better than at-risk control (ESs = .29 and .19 for the speeded and nonspeeded practice conditions, respectively). On word problems, the tutored groups again developed comparably (ES = .04, this time favoring nonspeeded practice) and better than at-risk control (ESs = .22 and .27 for speeded and nonspeeded practice, respectively).
We were also interested in extending understanding of the cognitive processes by which development on word problems occurred and whether the salient interactions between pretest cognitive resources and intervention differed for simple arithmetic versus word-problem outcomes. In predicting word problems, we simultaneously considered effects of seven cognitive resources and controlled for classroom nesting, pretest word-problem scores, and posttest simple arithmetic scores (to isolate effects on word problems beyond skill in adding and subtracting numbers in the word problems). This created a stringent test of cognitive moderators on word-problem learning. We identified two main effects: one for central executive working memory (βs = .08–.10) and the other for nonverbal reasoning (β = .13). This provides evidence for the role of these abilities in word-problem development and corroborates a substantial body of research, with effects of similar magnitude (e.g., Fuchs, Fuchs, Compton, et al., 2006; Fuchs, Geary, Compton, Fuchs, Hamlett, Seethaler, et al., 2010; Geary et al., 2012).
At the same time, we did find two moderators of intervention efficacy. First, word-problem learning depended more on individual differences in attentive behavior for students who received mathematics instruction in their classrooms (i.e., low-risk and at-risk control students) than for children who received tutoring (i.e., with nonspeeded or speeded practice; see Figure 2, Panel B). This interaction between attentive behavior and study condition may occur because tutoring, which occurs in a quiet location outside the classroom, reduces classroom distractions or because we incorporated methods to promote task-oriented behavior during tutoring. The present study was not designed to isolate the effects of such support for task-oriented behavior. Future research might examine how cognitive resources operate to moderate the effects of intervention with and without support for task-oriented behavior in the context of classrooms versus tutoring.
A second and more interesting interaction involved listening comprehension, which has been shown to play a role in word-problem development (e.g., Fuchs, Geary, Compton, Fuchs, Hamlett, Seethaler, et al., 2010; Swanson, 2006). Yet, in the present study, listening comprehension’s effect was evident in only three of four conditions (see Figure 2, Panel C): low risk, at-risk control, and nonspeeded practice. Speeded practice appeared to reduce the importance of listening comprehension in learning to solve word problems. This may occur because speeded practice creates greater automaticity with the simple arithmetic embedded in word problems, freeing up cognitive resources for deciphering word-problem narratives and identifying word-problem structures. Findings suggest that the cognitive predictors of arithmetic and word-problem learning are similar, with the notable exception of listening comprehension, as illustrated elsewhere (e.g., Fuchs, Fuchs, Compton, et al., 2006; Fuchs, Geary, Compton, Fuchs, Hamlett, & Seethaler, et al., 2010). Listening comprehension’s unique role in word problems makes sense because word problems involve processing problem narratives. In fact, understanding of relational terminology has been shown to mediate effects of word-problem intervention (Schumacher & Fuchs, 2012). Present findings do, however, suggest that the effects of listening comprehension can be attenuated with speeded practice to increase students’ fluency with the arithmetic embedded in word problems.
Conclusions
Before closing, we draw readers’ attention to the fact that although we controlled for the variance associated with the nature and quality of classroom instruction in our analyses, we did not describe mathematics instruction in the 227 participating classrooms. Such description may have enriched understanding of tutoring effects and helped contextualize the findings that (a) low-risk students’ arithmetic improvement was inferior to that of at-risk students who received number knowledge tutoring with speeded practice and (b) the arithmetic improvement of low-risk students with strong nonverbal reasoning was inferior to that of speeded-practice students with weak (and medium and high) nonverbal reasoning. International comparisons suggest that classroom instruction in the United States inadequately supports arithmetic development (Fennell et al., 2008). Our results raise additional concern and motivate future research in general education classrooms to investigate methods for enhancing development on this core mathematics competency. Such research might explore the efficacy of different forms of tutoring with and without different forms of classroom instruction, to assess whether the value of tutoring depends on the nature of classroom instruction.
Findings from the present study suggest that number knowledge tutoring, with nonspeeded or speeded practice, is effective for enhancing arithmetic, complex calculations, number knowledge, and word-problem learning over no tutoring. At the same time, well-designed speeded practice, delivered in the context of tutoring to build number knowledge, is more effective than nonspeeded practice in promoting complex calculations as well as simple arithmetic, a core mathematical competence. Effects favoring speeded over nonspeeded practice on simple arithmetic (and complex calculations) were substantial, and results showed that the advantage for speeded over nonspeeded practice may occur when students are helped to compensate for the demands on reasoning ability, which an instructional focus on number knowledge creates. At the same time, we found no evidence that speeded practice inhibits development of number knowledge or word-problem skill, despite the fact that rote responding was involved in speeded practice. In fact, both number knowledge tutoring conditions produced comparable number knowledge and word-problem learning, which was superior to at-risk control students.
More generally, interactions between cognitive resources and study condition provide insights into the processes by which intervention operates to affect mathematics development and illustrate how the effects of intervention may be depend on students’ pretest cognitive abilities. For example, the efficacy of number knowledge tutoring with nonspeeded practice on arithmetic depends on students’ pretest nonverbal reasoning; the efficacy of number knowledge tutoring with speeded practice, less so. This suggests potential for exploring aptitude-treatment interactions as a means of designing interventions in ways that capitalize on strengths and reduce the vulnerabilities associated with limitations in domain-general cognitive resources.
Finally, it is interesting that tutoring did not provide explicit instruction on word problems. Rather, word problems were included only for the purpose of helping students contextualize arithmetic problems and understand arithmetic principles. So it is not surprising that tutored children’s development of word-problem skills, although superior to that of at-risk control students (ESs = .22–.27), was substantially inferior to that of low-risk control children (ESs = .69–.73). This finding suggests the need to target word problems explicitly in tutoring for at-risk first graders, perhaps by adapting intervention approaches validated at higher grades (e.g., Fuchs, Fuchs, Craddock, et al., 2008; Fuchs, Zumeta, et al., 2010; Jitendra et al., 2007). The goal would be to reduce me role that key cognitive resources (i.e., nonverbal reasoning, listening comprehension, working memory, and attentive behavior) play in development. Present findings suggest that research might productively explore how individual differences in those cognitive resources moderate the effects of different forms of word-problem intervention.
Acknowledgments
This research was supported by Award Numbers R01 HD053714 and R37 HD0459M and by Core Grant HD15052 from the Eunice Kennedy Shriver National Institute of Child Health & Human Development to Vanderbilt University. The content is solely the responsibility of the authors and does not necessarily represent the official views of the Eunice Kennedy Shriver National Institute of Child Health & Human Development or the National Institutes of Health.
Appendix. Screening Measures to Constitute the Sample
First-Grade Test of Computational Fluency (Fuchs, Hamlett, & Fuchs, 1990)
This 25-item test samples the typical first-grade computation curriculum: adding two single-digit numbers (nine items), subtracting two single-digit numbers (10 items), adding three single-digit numbers (two items), adding two 2-digit numbers without regrouping (two items), and subtracting a 1-digit number from a 2-digit number (two items). Students have 2 min to complete as many items as possible. Staff entered responses into a computerized program on an item-by-item basis, with 15% of tests reentered by an independent scorer. Data-entry agreement was 99.6. Coefficient alpha was .96.
First-Grade Test of Mathematics Concepts and Applications (Fuchs et al., 1990)
This 25-item test samples the typical first-grade concepts and applications curriculum (i.e., numeration, concepts, geometry, measurement, applied computation, money, charts and graphs, and word problems). The tester reads the words in each item aloud. For 20 items, students have 15 s to respond; for 5 items, 30 s. Staff entered responses into a computerized program on an item-by-item basis, with 15% re-entered by an independent scorer. Data-entry agreement was 98.5%. Coefficient alpha was .94.
Word Identification Fluency (Fuchs, Fuchs, & Compton, 2004)
Students are given 1 min to read a list of 50 words randomly sampled from 100 high-frequency preprimer, primer, and first-grade words. If a student finishes before 1 min, the score is prorated. We administered two alternate forms and averaged scores. Alternate-form reliability/stability is .97; correlations with Woodcock Reading Mastery Test–Word Identification (Woodcock, 1997) are .77–.82.
Footnotes
We use the term condition in a methodological sense to refer to four types of study participation: number knowledge tutoring with speeded practice, number knowledge tutoring with nonspeeded practice, at-risk control, and low-risk control.
We relied on a reading-mathematics factor, because children with the most severe and persistent mathematics difficulty typically have comorbid reading problems (e.g., Geary et al., 2012; Jordan & Montani, 1997; Murphy, Mazzocco, Hanich, & Early, 2007). The fit of a single-factor model was acceptable, and a three-class solution was specified yielding high, average, and at-risk strata. We combined the high and average strata into a low-risk group
For the 11 and 12 Sets, counting-in for addition was adapted. For 5 + 7 = 12, students open hand to show 5, say “7” (without putting 7 in hand; this was the adaptation), and count 5, putting one finger at a time until all fingers are in hand; the answer is the last number counted. For subtraction, no adaptation was needed.
Each tutoring condition group exceeded the at-risk no-tutoring group: speeded practice versus at-risk no-tutoring, t(351) = 8.10, p < .001 (ES = .76), and nonspeeded practice versus at-risk no-tutoring, t(348) = 2.64 p < .009 (ES = .28). However, speeded practice outperformed nonspeeded practice, t(348) = 5.30, p < .001 (ES = .50). Moreover, the speeded group narrowed the achievement gap with respect to low-risk classmates, t(348) = 4.37, p < .001 (ES = .36), whereas students in the nonspeeded group did not, t(348) = 1.23, p = .220 (ES = .11), and students in the at-risk no-tutoring group lost substantial ground, t(348) = 4.12, p < .001 (ES = .36).
Because the two tutoring conditions were not significantly different on counting errors or retrieval, we did not contrast mediation effects for these conditions.
In the multiple mediation models, we relied on the Sobel standard error, which is accurate for minimum sample sizes of 100–200 (MacKinnon, Fairchild, & Fritz, 2007; Stone & Sobel, 1990).
Contributor Information
Lynn S. Fuchs, Department of Special Education, Vanderbilt University
David C. Geary, Department of Psychological Sciences, University of Missouri
Donald L. Compton, Department of Special Education, Vanderbilt University
Douglas Fuchs, Department of Special Education, Vanderbilt University.
Christopher Schatschneider, Department of Psychology, Florida State University.
Carol L. Hamlett, Department of Special Education, Vanderbilt University
Jacqueline DeSelms, Department of Special Education, Vanderbilt University.
Pamela M. Seethaler, Department of Special Education, Vanderbilt University
Julie Wilson, Department of Special Education, Vanderbilt University.
Caitlin F. Craddock, Department of Special Education, Vanderbilt University
Joan D. Bryant, Department of Special Education, Vanderbilt University
Kurstin Luther, Department of Special Education, Vanderbilt University.
Paul Changas, Department of Research, Assessment, and Evaluation, Metropolitan-Nashville Public Schools, Nashville, Tennessee.
References
- American Psychiatric Association. Diagnostic and statistical manual of mental disorders. 4. Washington, DC: Author; 1994. [Google Scholar]
- Anderson GL. Unpublished doctoral dissertation. University of Minnesota; Minneapolis: 1941. A comparison of the outcomes of instruction under two theories of learning. [Google Scholar]
- Baroody AJ. Mental-addition development of children classified as mentally handicapped. Educational Studies in Mathematics. 1988;19:369–388. doi: 10.1007/BF00312453. [DOI] [Google Scholar]
- Baroody AJ. Children’s relational understanding of addition and subtraction. Cognition and Instruction. 1999;17:137–175. doi: 10.1207/S1532690XCI170201. [DOI] [Google Scholar]
- Benjamini Y, Hochberg Y. Controlling the false discovery rate: A new and powerful approach to multiple testing. Journal of the Royal Statistical Society, Series B (Statistical Methodology) 1995;57:1289–1300. [Google Scholar]
- Bryant DP, Bryant BR, Roberts G, Vaughn S, Pfannenstiel KH, Porterfield J, Gersten R. Early numeracy intervention program for first-grade students with mathematics difficulties. Exceptional Children. 2011;78:7–23. [Google Scholar]
- Bull R, Johnston RS. Children’s arithmetical difficulties: Contributions from processing speed, item identification, and short-term memory. Journal of Experimental Child Psychology. 1997;65:1–24. doi: 10.1006/jecp.1996.2358. [DOI] [PubMed] [Google Scholar]
- Butterworth B. Foundational numerical capacities and the origins of dyscalculia. Trends in Cognitive Sciences. 2010;14:534–541. doi: 10.1016/j.tics.2010.09.007. [DOI] [PubMed] [Google Scholar]
- Butterworth B, Reigosa V. Information processing deficits in dyscalculia. In: Berch DB, Mazzocco MMM, editors. Why is math so hard for some children? The nature and origins of mathematical learning difficulties and disabilities. Baltimore, MD: Brookes; 2007. pp. 65–81. [Google Scholar]
- Bynner J. Basic skills in adolescents’ occupational preparation. Career Development Quarterly. 1997;45:305–321. doi: 10.1002/j.2161-0045.1997.tb00536.x. [DOI] [Google Scholar]
- Campbell JID, Xue Q. Cognitive arithmetic across cultures. Journal of Experimental Psychology: General. 2001;130:299–315. doi: 10.1037//0096-3445.130.2.299. [DOI] [PubMed] [Google Scholar]
- Cronbach LJ, Webb N. Between-class and within-class effects in a reported aptitude x treatment interaction: Reanalysis of a study by G. L. Anderson. Journal of Educational Psychology. 1975;67:717–724. doi: 10.1037/0022-0663.67.6.717. [DOI] [Google Scholar]
- Deary IJ, Strand S, Smith P, Fernandes C. Intelligence and educational achievement. Intelligence. 2007;35:13–21. doi: 10.1016/j.intell.2006.02.001. [DOI] [Google Scholar]
- De Smedt B, Gilmore CK. Defective number module or impaired access? Numerical magnitude processing in first graders with mathematical difficulties. Journal of Experimental Child Psychology. 2011;108:278–292. doi: 10.1016/j.jecp.2010.09.003. [DOI] [PubMed] [Google Scholar]
- De Smedt B, Janssen R, Bouwens K, Verschaffel L, Boets B, Ghesquière P. Working memory and individual differences in mathematics achievement: A longitudinal study from first grade to second grade. Journal of Experimental Child Psychology. 2009;103:186–201. doi: 10.1016/j.jecp.2009.01.004. [DOI] [PubMed] [Google Scholar]
- Duncan GJ, Dowsett CJ, Classens A, Magnuson K, Huston A, Klebanov P, Japel C. School readiness and later achievement. Developmental Psychology. 2007;43:1428–1446. doi: 10.1037/0012-1649.43.6.1428. [DOI] [PubMed] [Google Scholar]
- Every Child a Chance Trust. The long-term costs of numeracy difficulties. 2009 Retrieved August 14, 2009, from http://www.everychildachancetrust.org/counts/index.cfm.
- Fennell F, Faulkner LR, Ma L, Schmid W, Stotsky S, Wu H-H, Flawn T. Report of the task group on conceptual and skills. In: Faulkner L Chair, editor. Foundations for Success: Report of the National Mathematics Advisory Panel. Reports of the Task Groups and Subcommittees. Washington, DC: Department of Education; 2008. pp. 3-i–3-65. Retrieved from http://www.ed.gov/about/bdscomm/list/mathpanel/report/conceptual-knowledge.pdf. [Google Scholar]
- Fuchs LS, Compton DL, Fuchs D, Paulsen K, Bryant JD, Hamlett CL. The prevention, identification, and cognitive determinants of math difficulty. Journal of Educational Psychology. 2005;97:493–513. doi: 10.1037/0022-0663.97.3.493. [DOI] [Google Scholar]
- Fuchs LS, Fuchs D, Bryant VJ. Galaxy math. L. S. Fuchs; 228 Peabody, Vanderbilt University, Nashville, TN 37203: 2010. [Google Scholar]
- Fuchs LS, Fuchs D, Compton DL. Monitoring early reading development in first grade: Word identification fluency versus nonsense word fluency. Exceptional Children. 2004;71:7–21. doi: 10.1177/001440291207800204. [DOI] [PMC free article] [PubMed] [Google Scholar]
- Fuchs LS, Fuchs D, Compton DL, Powell SR, Seethaler PM, Capizzi AM, Fletcher JM. The cognitive correlates of third-grade skill in arithmetic, algorithmic computation, and arithmetic word problems. Journal of Educational Psychology. 2006;98:29–43. doi: 10.1037/0022-0663.98.1.29. [DOI] [Google Scholar]
- Fuchs LS, Fuchs D, Craddock C, Hollenbeck KN, Hamlett CL, Schatschneider C. Effects of small-group tutoring with and without validated classroom instruction on at-risk students’ math problem solving: Are two tiers of prevention better than one? Journal of Educational Psychology. 2008;100:491–509. doi: 10.1037/0022-0663.100.3.491. [DOI] [PMC free article] [PubMed] [Google Scholar]
- Fuchs LS, Fuchs D, Hamlett CL, Powell SR, Capizzi AM, Seethaler PM. The effects of computer-assisted instruction on number combination skill in at-risk first graders. Journal of Learning Disabilities. 2006;39:467–475. doi: 10.1177/00222194060390050701. [DOI] [PubMed] [Google Scholar]
- Fuchs LS, Fuchs D, Stuebing K, Fletcher JM, Hamlett CL, Lambert WE. Problem-solving and computation skills: Are they shared or distinct aspects of mathematical cognition? Journal of Educational Psychology. 2008;100:30–47. doi: 10.1037/0022-0663.100.1.30. [DOI] [PMC free article] [PubMed] [Google Scholar]
- Fuchs LS, Geary DC, Compton DL, Fuchs D, Hamlett CL, Bryant JV. The contributions of numerosity and domain-general abilities to school readiness. Child Development. 2010;81:1520–1533. doi: 10.1111/j.1467-8624.2010.01489.x. [DOI] [PMC free article] [PubMed] [Google Scholar]
- Fuchs LS, Geary DC, Compton DL, Fuchs D, Hamlett CL, Seethaler PM, Bryant JV, Schatschneider C. Do different types of school mathematics development depend on different constellations of numerical and general cognitive abilities? Developmental Psychology. 2010;46:1731–1746. doi: 10.1037/a0020662. [DOI] [PMC free article] [PubMed] [Google Scholar]
- Fuchs LS, Hamlett CL, Fuchs D. First grade test of computational fluency and first-grade test of mathematics concepts and applications. L. S. Fuchs; 228 Peabody, Vanderbilt University, Nashville, TN 37203: 1990. [Google Scholar]
- Fuchs LS, Hamlett CL, Powell SR. First-Grade Mathematics Assessment Battery. L. S. Fuchs; 228 Peabody, Vanderbilt University, Nashville, TN 37203: 2003. [Google Scholar]
- Fuchs LS, Powell SR, Seethaler PM, Fuchs D, Hamlett CL, Cirino PT, Fletcher JM. A framework for remediating the number combination deficits of students with mathematics difficulty. Exceptional Children. 2010;76:135–156. doi: 10.1177/001440291007600201. [DOI] [PMC free article] [PubMed] [Google Scholar]
- Fuchs LS, Zumeta RO, Schumacher RF, Powell SR, Seethaler PM, Hamlett CL, Fuchs D. The effects of schema-broadening instruction on second graders’ word-problem performance and their ability to represent word problems with algebraic equations: A randomized control study. Elementary School Journal. 2010;110:440–463. doi: 10.1086/651191. [DOI] [PMC free article] [PubMed] [Google Scholar]
- Fuson KC, Kwon Y. Korean children’s single-digit addition and subtraction: Numbers structured by ten. Journal for Research in Mathematics Education. 1992;23:148–165. doi: 10.2307/749498. [DOI] [Google Scholar]
- Geary DC. A componential analysis of an early learning deficit in mathematics. Journal of Experimental Child Psychology. 1990;49:363–383. doi: 10.1016/0022-0965(90)90065-G. [DOI] [PubMed] [Google Scholar]
- Geary DC. Mathematical disabilities: Cognitive, neuropsychological, and genetic components. Psychological Bulletin. 1993;114:345–362. doi: 10.1037/0033-2909.114.2.345. [DOI] [PubMed] [Google Scholar]
- Geary DC. Children’s mathematical development: Research and practical applications. Washington, DC: American Psychological Association; 1994. [DOI] [Google Scholar]
- Geary DC. Cognitive predictors of individual differences in achievement growth in mathematics: A five year longitudinal study. Developmental Psychology. 2011;47:1539–1552. doi: 10.1037/a0025510. [DOI] [PMC free article] [PubMed] [Google Scholar]
- Geary DC, Bailey DH, Hoard MK. Predicting mathematical achievement and mathematical learning disability with a simple screening tool: The Number Sets Test. Journal of Psychoeducational Assessment. 2009;27:265–279. doi: 10.1177/0734282908330592. [DOI] [PMC free article] [PubMed] [Google Scholar]
- Geary DC, Boykin AW, Embretson S, Reyna V, Siegler R, Berch DB, Graban J. Report of the task group on learning processes. In: Faulkner L Chair, editor. Foundations for Success: Report of the National Mathematics Advisory Panel. Reports of the Task Groups and Subcommittees. Washington, DC: U.S. Department of Education; 2008. pp. 4-iii–4-221. Retrieved from http://www.ed.gov/about/bdscomm/list/mathpanel/report/learning-processes.pdf. [Google Scholar]
- Geary DC, Brown SC, Samaranayake VA. Cognitive addition: A short longitudinal study of strategy choice and speed-of-processing differences in normal and mathematically disabled children. Developmental Psychology. 1991;27:787–797. doi: 10.1037/0012-1649.27.5.787. [DOI] [Google Scholar]
- Geary DC, Hoard MK, Byrd-Craven J, Nugent L, Numtee C. Cognitive mechanisms underlying achievement deficits in children with mathematical learning disability. Child Development. 2007;78:1343–1359. doi: 10.1111/j.1467-8624.2007.01069.x. [DOI] [PMC free article] [PubMed] [Google Scholar]
- Geary DC, Hoard MK, Nugent L. Independent contributions of the central executive, intelligence, and in-class attentive behavior to developmental change in the strategies used to solve addition problems. Journal of Experimental Child Psychology. doi: 10.1016/j.jecp.2012.03.003. in press. [DOI] [PMC free article] [PubMed] [Google Scholar]
- Geary DC, Hoard MK, Nugent L, Bailey DH. Mathematical cognition deficits in children with learning disabilities and persistent low achievement: A five year prospective study. Journal of Educational Psychology. 2012;104:206–223. doi: 10.1037/a0025398. [DOI] [PMC free article] [PubMed] [Google Scholar]
- Geary DC, Widaman KF. Numerical cognition: On the convergence of componential and psychometric models. Intelligence. 1992;16:47–80. doi: 10.1016/0160-2896(92)90025-M. [DOI] [Google Scholar]
- Goldman SR, Pellegrino JW, Mertz DL. Extended practice of addition facts: Strategy changes in learning-disabled students. Cognition and Instruction. 1988;5:223–265. doi: 10.1207/s1532690xci0503_2. [DOI] [Google Scholar]
- Groen G, Resnick LB. Can preschool children invent addition algorithms? Journal of Educational Psychology. 1977;69:645–652. doi: 10.1037/0022-0663.69.6.645. [DOI] [Google Scholar]
- Hecht SA, Torgesen JK, Wagner RK, Rashotte CA. The relations between phonological processing abilities and emerging individual differences in mathematical computational skills: A longitudinal study from second to fifth grades. Journal of Experimental Child Psychology. 2001;79:192–227. doi: 10.1006/jecp.2000.2586. [DOI] [PubMed] [Google Scholar]
- Holloway ID, Ansari D. Mapping numerical magnitudes onto symbols: The numerical distance effect and individual differences in children’s mathematics achievement. Journal of Experimental Child Psychology. 2009;103:17–29. doi: 10.1016/j.jecp.2008.04.001. [DOI] [PubMed] [Google Scholar]
- Institute of Education Sciences, National Center for Education Statistics. The condition of education 2007 (NCES 2007–064) 2009 Retrieved from http://nces.ed.gov/programs/coe/index.asp.
- Iuculano T, Tang J, Hall CWB, Butterworth B. Core information processing deficits in developmental dyscalculia and low numeracy. Developmental Science. 2008;11:669–680. doi: 10.1111/j.1467-7687.2008.00716.x. [DOI] [PubMed] [Google Scholar]
- Jitendra AK, Griffin C, Haria P, Leh J, Adams A, Kaduvetoor A. A comparison of single and multiple strategy instruction on third grade students’ mathematical problem solving. Journal of Educational Psychology. 2007;99:115–127. doi: 10.1037/0022-0663.99.1.115. [DOI] [Google Scholar]
- Jordan NC, Hanich L. Mathematical thinking in second-grade children with different forms of LD. Journal of Learning Disabilities. 2000;33:567–578. doi: 10.1177/002221940003300605. [DOI] [PubMed] [Google Scholar]
- Jordan NC, Hanich LB, Kaplan D. Arithmetic fact mastery in young children: A longitudinal investigation. Journal of Experimental Child Psychology. 2003;85:103–119. doi: 10.1016/S0022-0965(03)00032-8. [DOI] [PMC free article] [PubMed] [Google Scholar]
- Jordan NC, Huttenlocher J, Levine SC. Differential calculation abilities in young children from middle- and low-income families. Developmental Psychology. 1992;28:644–653. doi: 10.1037/0012-1649.28.4.644. [DOI] [Google Scholar]
- Jordan NC, Montani TO. Cognitive arithmetic and problem solving: A comparison of children with specific and general mathematics difficulties. Journal of Learning Disabilities. 1997;30:624–634. doi: 10.1177/002221949703000606. [DOI] [PubMed] [Google Scholar]
- Koontz KL, Berch DB. Identifying simple numerical stimuli: Processing inefficiencies exhibited by arithmetic learning disabled children. Mathematical Cognition. 1996;2:1–24. doi: 10.1080/135467996387525. [DOI] [Google Scholar]
- Krajewski K, Schneider W. Early development of quantity to number-word linkage as a precursor of mathematical school achievement and mathematical difficulties: Findings from a four-year longitudinal study. Learning and Instruction. 2009;19:513–526. doi: 10.1016/j.learninstruc.2008.10.002. [DOI] [Google Scholar]
- Kroesbergen EH, van Luit JEH, Van Lieshout ECDM, Van Loosbroek E, Van de Rijt BAM. Individual differences in early numeracy: The role of executive functions and subitizing. Journal of Psychoeducational Assessment. 2009;27:226–236. doi: 10.1177/0734282908330586. [DOI] [Google Scholar]
- Landerl K, Kölle C. Typical and atypical development of basic numerical skills in elementary school. Journal of Experimental Child Psychology. 2009;103:546–565. doi: 10.1016/j.jecp.2008.12.006. [DOI] [PubMed] [Google Scholar]
- LeFevre JA, Morris J. More on the relation between division and multiplication in simple arithmetic: Evidence for mediation of division solutions via multiplication. Memory & Cognition. 1999;27:803–812. doi: 10.3758/BF03198533. [DOI] [PubMed] [Google Scholar]
- Levine SC, Jordan NC, Huttenlocher J. Development of calculation abilities in young children. Journal of Experimental Child Psychology. 1992;53:72–103. doi: 10.1016/S0022-0965(05)80005-0. [DOI] [PubMed] [Google Scholar]
- Littell RC, Milliken GA, Stroup WW, Wolfinger RD, Schabenberger O. SAS for mixed models. 2. Cary, NC: SAS Institute; 2006. [Google Scholar]
- Little RJA. A test of missing completely at random for multivariate data with missing values. Journal of the American Statistical Association. 1988;83:1198–1202. doi: 10.1080/01621459.1988.10478722. [DOI] [Google Scholar]
- Logie RH, Baddeley AD. Cognitive processes in counting. Journal of Experimental Psychology: Learning, Memory, and Cognition. 1987;13:310–326. doi: 10.1037/0278-7393.13.2.310. [DOI] [Google Scholar]
- MacKinnon DP, Fairchild AJ, Fritz MS. Mediation analysis, Annual Review of Psychology. 2007;58:593–614. doi: 10.1146/annurev.psych.58.110405.085542. [DOI] [PMC free article] [PubMed] [Google Scholar]
- MacMillan NA. Signal detection theory. In: Wixted J, Pashler H, editors. Stevens’ handbook of experimental psychology: Methodology in experimental psychology. 3. Vol. 4. New York, NY: Wiley; 2002. pp. 43–90. [Google Scholar]
- Montague M. Self-regulation and mathematics instruction. Learning Disabilities Research & Practice. 2007;22:75–83. doi: 10.1111/j.1540-5826.2007.00232.x. [DOI] [Google Scholar]
- Murphy MM, Mazzocco MMM, Hanich LB, Early MC. Cognitive characteristics of children with mathematics learning disability (MLD) vary as a function of the cutoff criterion used to define MLD. Journal of Learning Disabilities. 2007;40:458–478. doi: 10.1177/00222194070400050901. [DOI] [PubMed] [Google Scholar]
- National Mathematics Advisory Panel. Foundations for success: Final Report of the National Mathematics Advisory Panel. Washington, DC: United States Department of Education; 2008. Retrieved from http://www.ed.gov/about/bdscomm/list/mathpanel/report/final-report.pdf. [Google Scholar]
- National Research Council. Adding it up: Helping children learn mathematics. Washington, DC: National Academies Press; 2001. [Google Scholar]
- Pickering S, Gathercole S. Working Memory Test Battery for Children. London, England: Psychological Corporation; 2001. [Google Scholar]
- Preacher KJ, Hayes AF. Asymptotic and resampling strategies for assessing and comparing indirect effects in multiple mediator models. Behavior Research Methods. 2008;40:879–891. doi: 10.3758/BRM.40.3.879. [DOI] [PubMed] [Google Scholar]
- Price GR, Holloway I, Räsänen P, Vesterinen M, Ansari D. Impaired parietal magnitude processing in developmental dyscalculia. Current Biology. 2007;17:R1042–R1043. doi: 10.1016/j.cub.2007.10.013. [DOI] [PubMed] [Google Scholar]
- Rathmell EC. Using thinking strategies to teach the basic facts. NCTM Yearbook. 1978;78:13–38. [Google Scholar]
- Rickard TC, Healy AF, Bourne LE., Jr On the cognitive structure of basic arithmetic skills: Operation, order, and symbol transfer effects. Journal of Experimental Psychology: Learning, Memory, and Cognition. 1994;20:1139–1153. [Google Scholar]
- Rousselle L, Noel MP. Basic numerical skills in children with mathematics learning disabilities: A comparison of symbolic vs. non-symbolic number magnitude processing. Cognition. 2007;102:361–395. doi: 10.1016/j.cognition.2006.01.005. [DOI] [PubMed] [Google Scholar]
- Schumacher RF, Fuchs LS. Does understanding relational terminology mediate effects of intervention on compare word problems? Journal of Experimental Child Psychology. 2012;111:607–628. doi: 10.1016/j.jecp.2011.12.001. [DOI] [PMC free article] [PubMed] [Google Scholar]
- Siegler RS. The perils of averaging data over strategies: An example from children’s addition. Journal of Experimental Psychology: General. 1987;116:250–264. doi: 10.1037/0096-3445.116.3.250. [DOI] [Google Scholar]
- Siegler RS, Robinson M. The development of numerical understandings. In: Reese H, Lipsitt LP, editors. Advances in child development and behavior. Vol. 16. New York, NY: Academic; 1982. pp. 241–312. [DOI] [PubMed] [Google Scholar]
- Siegler RS, Shrager J. Strategy choice in addition and subtraction: How do children know what to do? In: Sophian C, editor. Origins of cognitive skills. Hillsdale, NJ: Erlbaum; 1984. pp. 229–293. [Google Scholar]
- Smith TB, Cobb P, Farran D, Cordray D, Munster C. Evaluating math recovery: Assessing the causal impact of a diagnostic tutoring program on student achievement. 2011. Manuscript submitted for publication. [Google Scholar]
- Stone CA, Sobel ME. The robustness of estimates of total indirect effects in covariance structure models estimated by maximum likelihood. Psychometrika. 1990;55:337–352. doi: 10.1007/BF02295291. [DOI] [Google Scholar]
- Swanson HL. Cross-sectional and incremental changes in working memory and mathematical problem solving. Journal of Educational Psychology. 2006;98:265–281. doi: 10.1037/0022-0663.98.2.265. [DOI] [Google Scholar]
- Swanson HL, Beebe-Frankenberger M. The relationship between working memory and mathematical problem solving in children at risk and not at risk for serious mathematics difficulties. Journal of Educational Psychology. 2004;96:471–491. doi: 10.1037/0022-0663.96.3.471. [DOI] [Google Scholar]
- Swanson HL, Sachse-Lee C. Mathematical problem solving and working memory in children with learning disabilities: Both executive and phonological processes are important. Journal of Experimental Child Psychology. 2001;79:294–321. doi: 10.1006/jecp.2000.2587. [DOI] [PubMed] [Google Scholar]
- Swanson J, Schuck S, Mann M, Carlson C, Hartmann K, Sergeant J, McCleary Categorical and dimensional definitions and evaluations of symptoms of ADHD: The SNAP and the SWAN Rating Scales. 2004 Retrieved from www.adhd.net/SNAP_SWAN.pdf. [PMC free article] [PubMed]
- Taub GE, Floyd RG, Keith TZ, McGrew KS. Effects of general and cognitive abilities on mathematics achievement. School Psychology Review. 2008;23:187–198. doi: 10.1037/1045-3830.23.2.187. [DOI] [Google Scholar]
- Wechsler D. Wechsler Abbreviated Scale of Intelligence. San Antonio, TX: Psychological Corporation; 1999. [Google Scholar]
- Wechsler D. The Wechsler Intelligence Scale for Children. 3. San Antonio, TX: Psychological Corporation; 1991. [Google Scholar]
- Wilkinson GS. Wide Range Achievement Test 3. 3. Wilmington, DE: Wide Range; 1993. [Google Scholar]
- Woodcock RW. Woodcock Diagnostic Reading Battery. Itasca, IL: Riverside; 1997. [Google Scholar]
- Woodcock RW, McGrew KS, Mather N. Woodcock–Johnson III. Itasca, IL: Riverside; 2001. [Google Scholar]