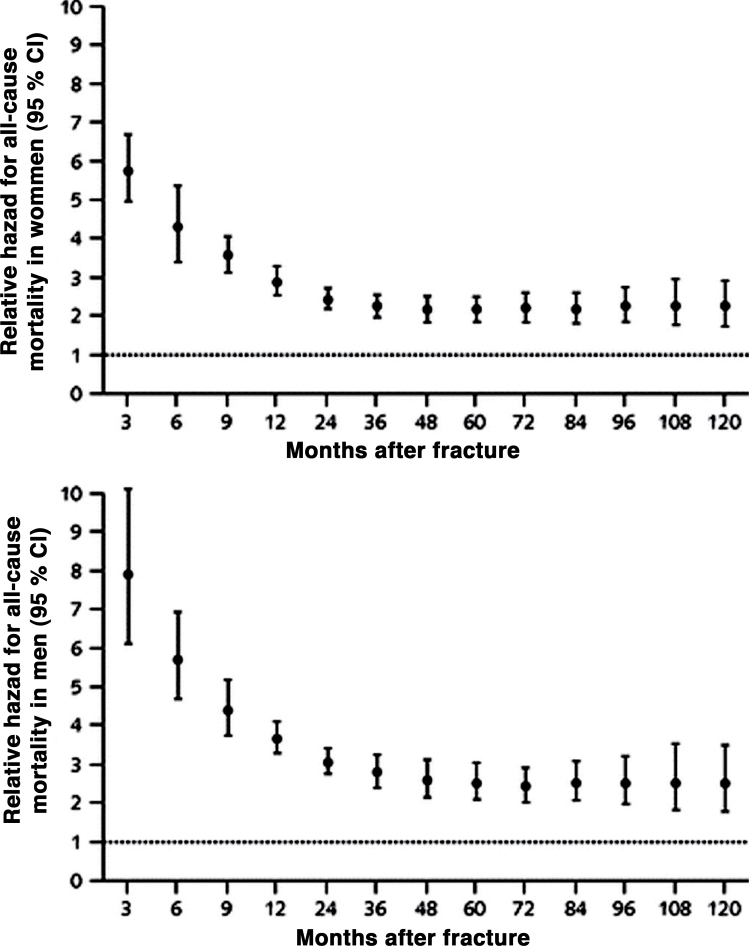
Figure 1.
Relative hazard of all-cause mortality for women and men with hip fracture versus control groups during a given follow-up period starting at the time of injury.
Solid circles represent the pooled relative hazard. Vertical bars represent the corresponding 95% CIs. The dotted horizontal line is the null effect (22).

