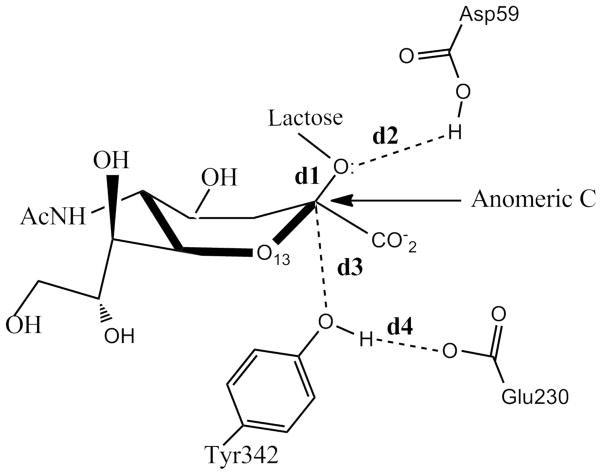
Figure 2.
Distances used to scan the 2-D reaction coordinate. d1 refers to the distance between the anomeric C atom of sialic acid and and the glycosidic O of lactose. d2 is the distance between the glucosidic O of lactose and the H atom of the carboxylic group of Asp59, d3 the one between the anomeric C of the sialic acid and the hydroxyl O atom of Tyr342 and d4 described that that involves one carboxyl O atom of Glu230 and the hydroxyl H atom of Tyr342.

