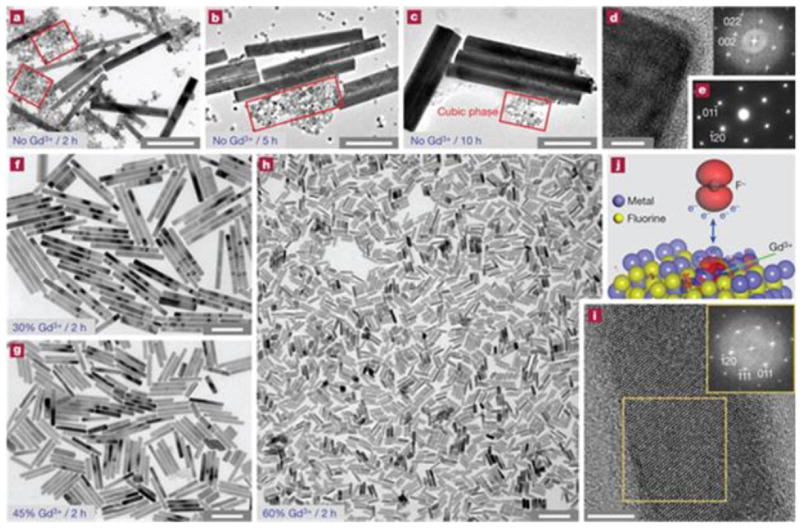
Fig. 16.

Simultaneous phase and size control of UCNPs through lanthanide doping. (a–c), TEM images of NaYF4:Yb3+/Er3+ (18/2 mol%) products in the absence of Gd3+ dopant ions. (d) HRTEM image of UCNPs. (e) Selected area electron diffraction pattern of UCNPs in (a). (f-h) TEM images of the NaYF4:Yb3+/Er3+ (18/2 mol%) products. (i) HRTEM image of UCNPs in (h). (j) DFT calculation. Scale bars are 500 nm in (a–c), 200 nm in (f–h) and 5 nm in (d) and (i). Reprinted with permission from ref. [316].
