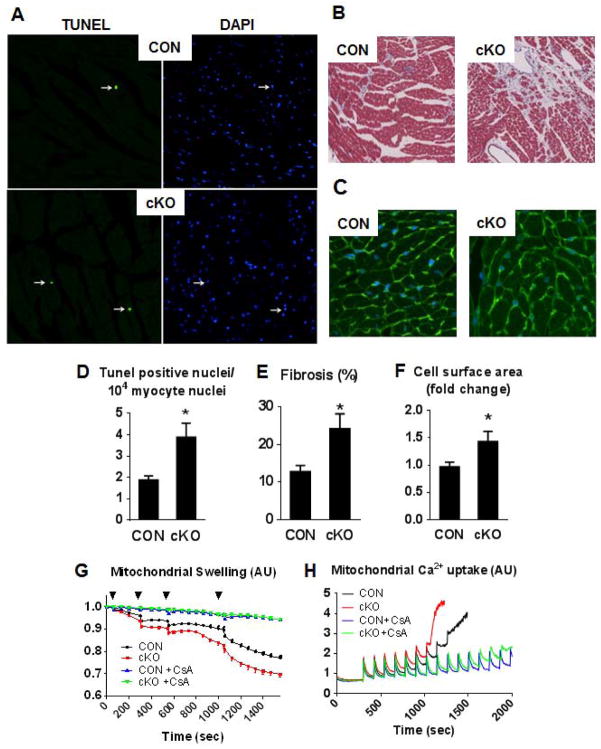
Figure 4. Increased cell death in the cKO hearts.
Representative image of (A) TUNEL and DAPI stain for apoptotic nuclei, (B) trichrome stain for fibrosis and (C) WGA stain to outlining the cell surface area in female CON and cKO mice after 6 gestational cycles and quantitation graphs of those (D–F; n=4 per group, *P<0.05 vs CON). (G) Mitochondrial swelling induced by Ca2+ pulsing (25 μM [Ca2+] increments in the reaction buffer) indicated by the black triangle measured as % decrease in the initial optical density (OD 540) in the presence or absence of 1 μM CsA (this experiment was repeated at least 5 times). (H) Representative Ca2+ uptake traces by mitochondria in the presence or absence of 1 μM CsA. Ca2+ was added to achieve 15 μM [Ca2+] increments in the reaction buffer (this experiment was repeated at least 3 times). Data are expressed as means ± SEM.

