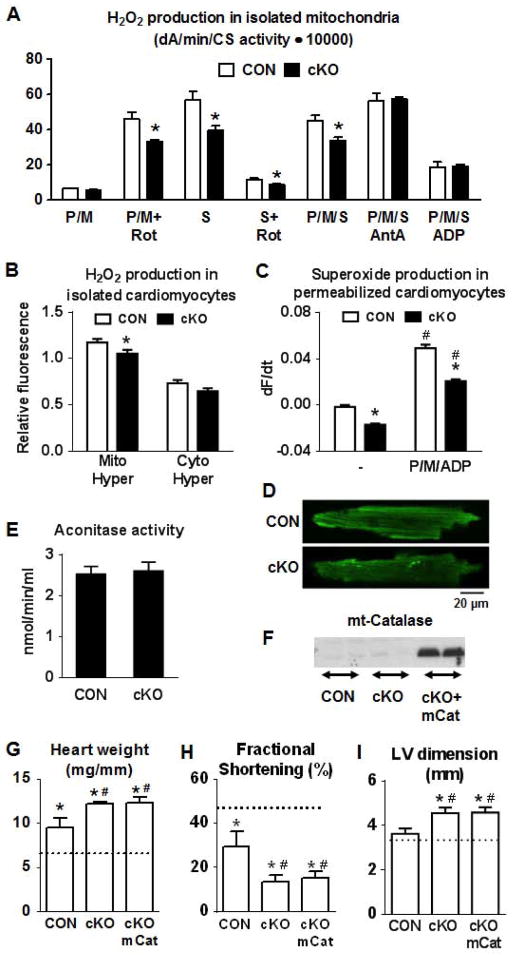
Figure 5. ROS production is not increased in the cKO hearts.
(A) Measurement of H2O2 production using Amplex Red in isolated cardiac mitochondria from CON (white) and cKO (black) mice treated with pyruvate/malate (10/5 mM; P/M), succinate (10 mM; S), rotenone (10 μM; Rot), Antimicyn A (1 mg/ml; AntA), ADP (2.5 mM) or combinations of those (n=4) and (B) mitochondrial or cytosolic H2O2 production in isolated cardiomyocytes using a fluorescent probe targeted to mitochondria (Mito-Hyper) or to cytosol (Cyto-Hyper; n=27–43; *P<0.05 vs CON). (C) Data showing the change of MitoSOX fluorescence at 405 nm excitation during a 5 min period before (−) or after the addition of respiration substrates (P/M/ADP). Data are expressed as mean ± SEM (n=9–10 cells from 2–3 mice; #P<0.05 P/M/ADP vs. non-treated; *P< 0.05 cKO vs. CON). (D) Representative images of CON and cKO permeabilized cardiomyocytes showing the MitoSOX fluorescence at 5 min after the addition of respiration substrates (10 mM pyruvate, 5 mM malate and 2 mM ADP). (E) Cardiac tissue aconitase enzyme activity (n=3). Data are expressed as means ± SEM. (F) Representative western blot for mitochondrial catalase in hearts from CON, cKO and cKO/mCat mice. (G) Heart weight normalized to tibia length, (H) fractional shortening and (I) LV end-diastolic dimension at 4 weeks after TAC or sham surgery (n=11 for the cKO/mCat TAC group and n=5 for the rest of the groups). Data are expressed as means ± SEM. *P<0.05 vs the respective sham indicated by the dotted line and #P<0.05 vs CON-TAC.

