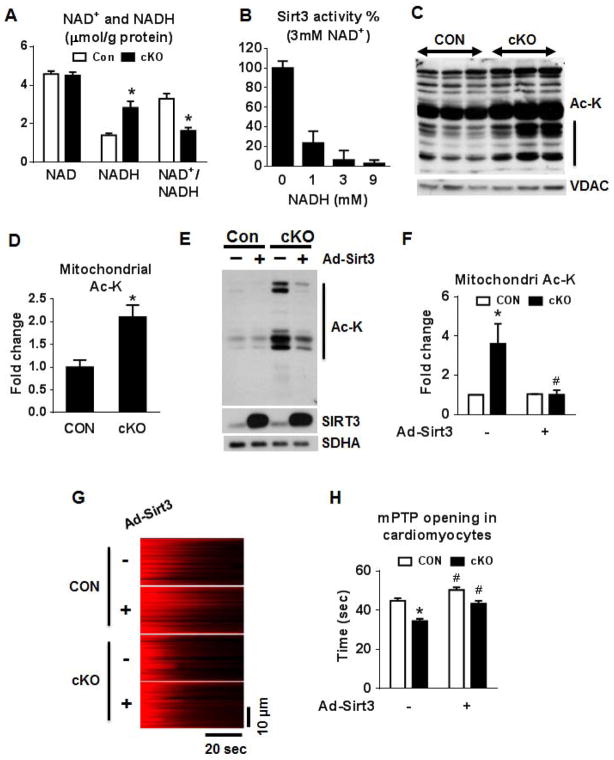
Figure 6. NAD+/NADH regulates mitochondrial protein acetylation via SIRT3.
(A) NADH and NAD+ concentrations in freeze-clamped mouse hearts from CON and cKO mice (n=5). (B) Sirt3 activity assay using a 3 mM of NAD+ and 0–9 mM of NADH. (C) Representative blot for acetylated lysine residues (Ac-K) and VDAC (loading control), and (D) a quantitation graph in cardiac mitochondrial extracts (n=4; vertical line in graph C indicates the area on the blot used for quantitation). (E) Western blot and (F) a quantitation graph of Ac-K residues in isolated cardiomyocytes from CON and cKO hearts overexpressing Sirt3. SIRT3 protein levels and SDHA (loading control) are also shown (n=3). (G) Representative linescan confocal images showing the laser induced mPTP opening in cultured adult cardiac myocytes as reflected by the sudden loss of membrane potential (TMRM, red color). (H) Summarized data showing the time from the start of scan to the mPTP opening (mPTP time), the shorter the time the more sensitive of the mPTP. n = 120–143 mitochondria from 21–25 cells isolated from 3 hearts in each group. All data are expressed as means ± SEM. *P<0.05 versus Con. #P<0.05 versus without AdSirt3. See also Figures S5.

