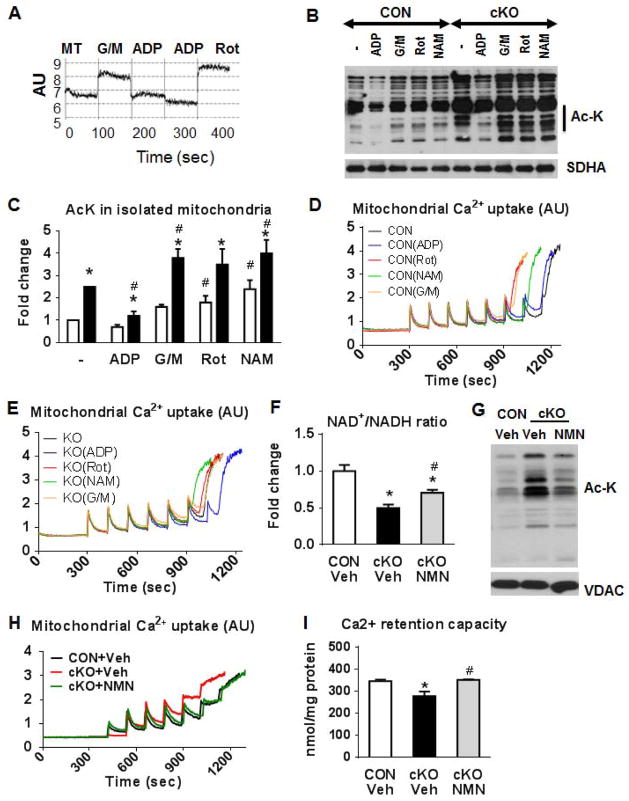
Figure 7. Regulation of the mPTP by mitochondrial NADH and protein acetylation.
(A) Representative NADH autofluorescence trace using isolated mitochondria stimulated with glutamate/malate (G/M; 10/5 mM), ADP (250 μM) or Rot (1 μM) added in this order consecutively in the same trace. (B) A representative western blot and (C) a quantitation graph for Ac-K residues in protein extracts of CON and cKO mitochondria pre-treated separately with G/M (10/5 mM), or ADP (250 μM), or Rot (1 μM) or nicotinamide (NAM; 10 mM) for 20 min at 30°C (vertical line in graph B indicates the area on the blot used for quantitation), SDHA was used as loading controls. *P<0.05 vs CON non-treated and #P<0.05 vs cKO non-treated. Representative Ca2+ uptake traces from (D) CON and (E) cKO mitochondria, isolated in the presence or absence of G/M (10/5 mM), ADP (250 μM), Rot (1 μM) or NAM (10 mM). Each experiment was repeated at least 3 times. (F) NAD+/NADH ratio in freeze-clamped mouse hearts from CON and cKO mice treated with vehicle or cKO treated with nicotinamide mononucleotide (NMN) as described in Methods (n=3). (G) Representative Western blots for Ac-K residues and VDAC (loading control) in CON and cKO cardiac mitochondria from mice treated with vehicle or NMN. (H) Ca2+ uptake traces and (I) quantitation graph from cardiac mitochondria isolated from CON and cKO mice treated with vehicle or NMN. Data in Panels F and I are expressed as means ± SEM. *P<0.05 vs CON-Veh and #P<0.05 vs cKO-Veh.

