
Figure 3.
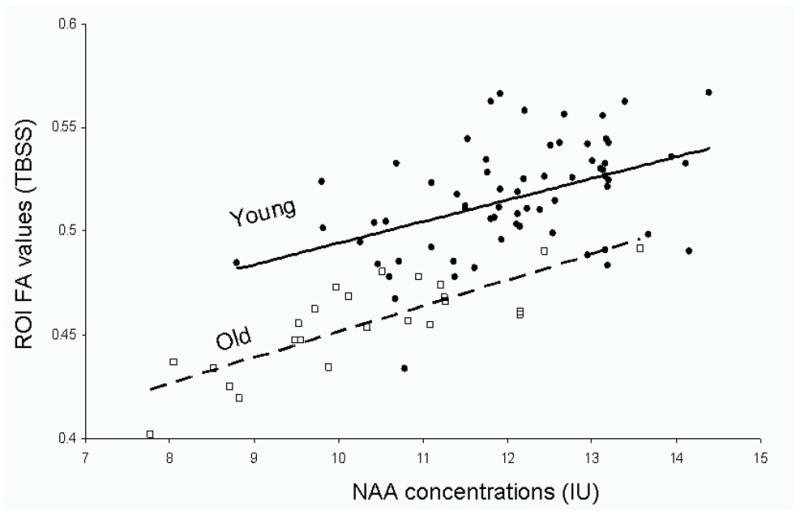
FA values for the spectroscopic region of interest (sROI) and the corresponding linear trends were plotted vs. NAA concentrations in the young (solid circle markers, dashed line, FA=0.010*[NAA] + 0.39, r2=0.21, p=0.0002) and old (hollow square markers, FA=0.013*[NAA] + 0.33, r2=0.66, p=0.00001) cohorts.