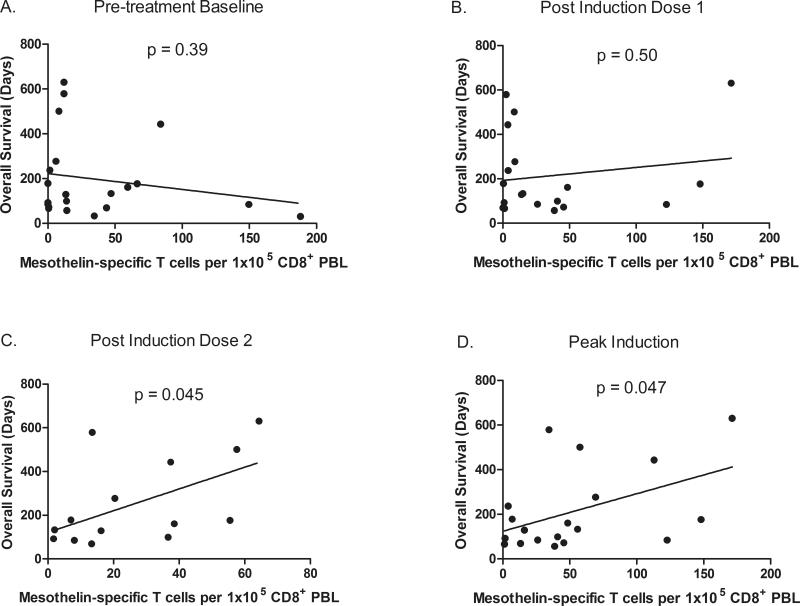
Figure 3. Increased levels of peak and post-induction dose 2 mesothelin-specific T cells are associated with longer survival.
Frequencies of mesothelin-specific T cells measured by IFNγ ELISPOT in PBL isolated A) prior to treatment, B) following the initial treatment, C) following the second treatment and D) at the time of peak induction are plotted against overall survival. Linear regressions were performed and respective p values are shown for each timepoint.

