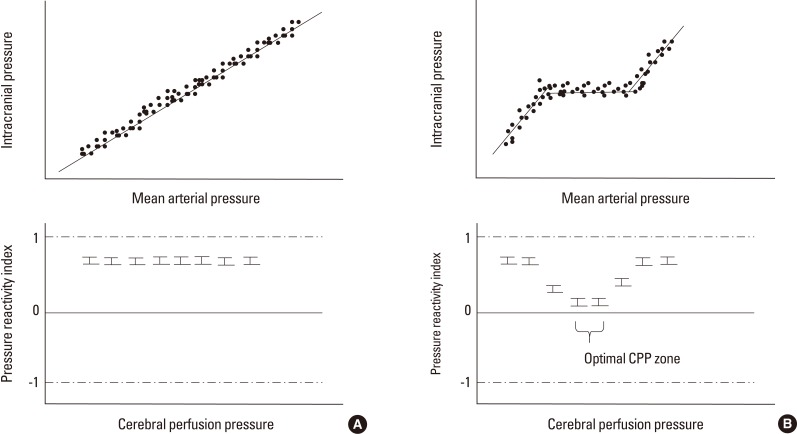
Figure 4.
Identifying optimal cerebral perfusion pressure. In patients with a loss of autoregulation, the relationship between intracranial pressure and mean arterial pressure appears to be linear. When the pressure reactivity index was plotted at a specific cerebral perfusion pressure, there was no nadir in the plot, suggesting no better spot for autoregulation (A). In patients with intact autoregulation, the mean pressure reactivity index values at specific cerebral perfusion pressure ranges were lower than those at other cerebral perfusion pressures, suggesting that the nadir existed in terms of the pressure reactivity-cerebral perfusion pressure plot and that the optimal cerebral perfusion pressure range existed (B).

