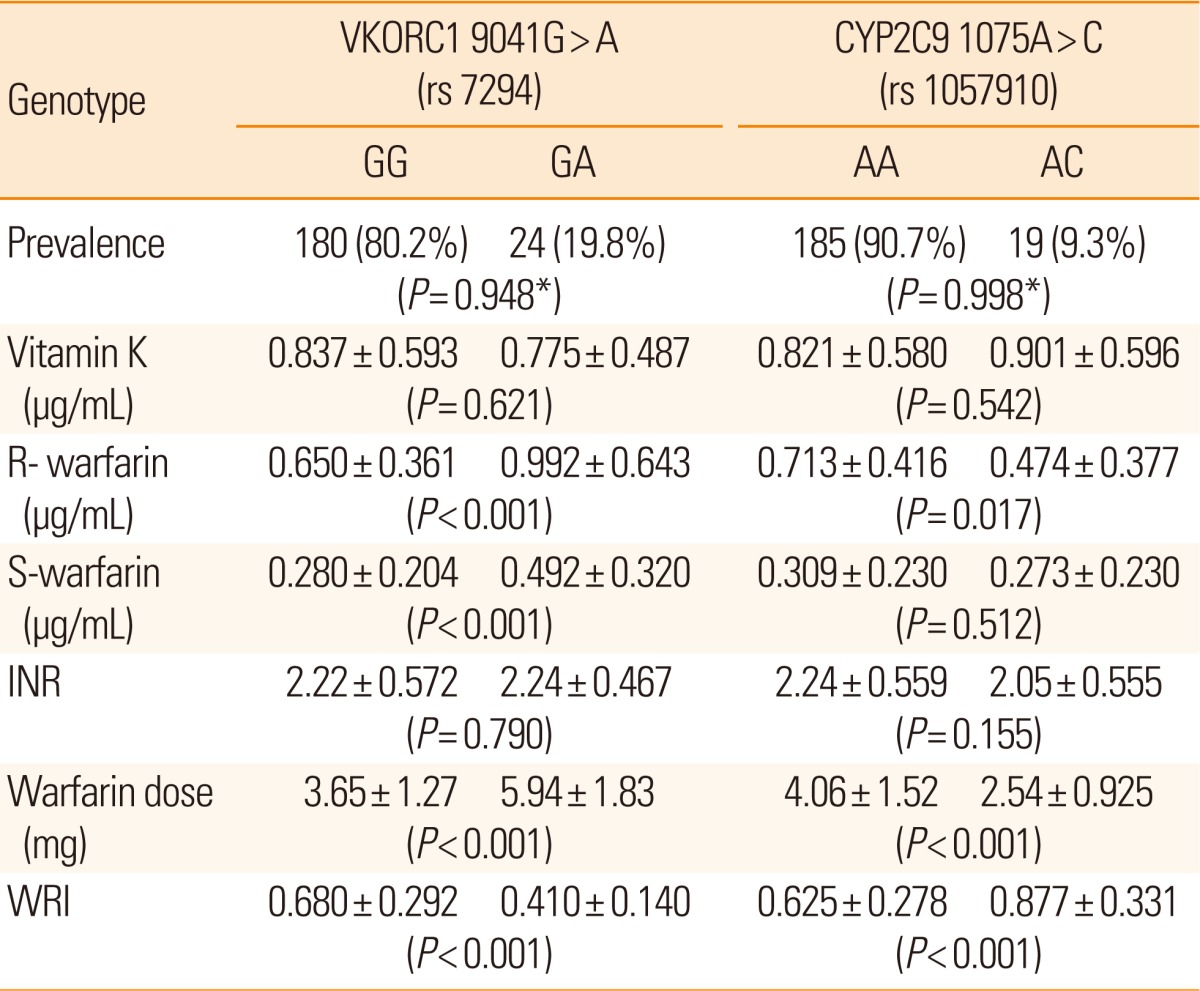
Table 2.
Characteristics of different genotypes

*P value in the Hardy-Weinberg equilibrium, Chi-square test; Univariate analysis, such as Student's t-test and Mann-Whitney test, with Bonferroni correction for dichotomized variables.
Characteristics of different genotypes

*P value in the Hardy-Weinberg equilibrium, Chi-square test; Univariate analysis, such as Student's t-test and Mann-Whitney test, with Bonferroni correction for dichotomized variables.