
Figure 5.
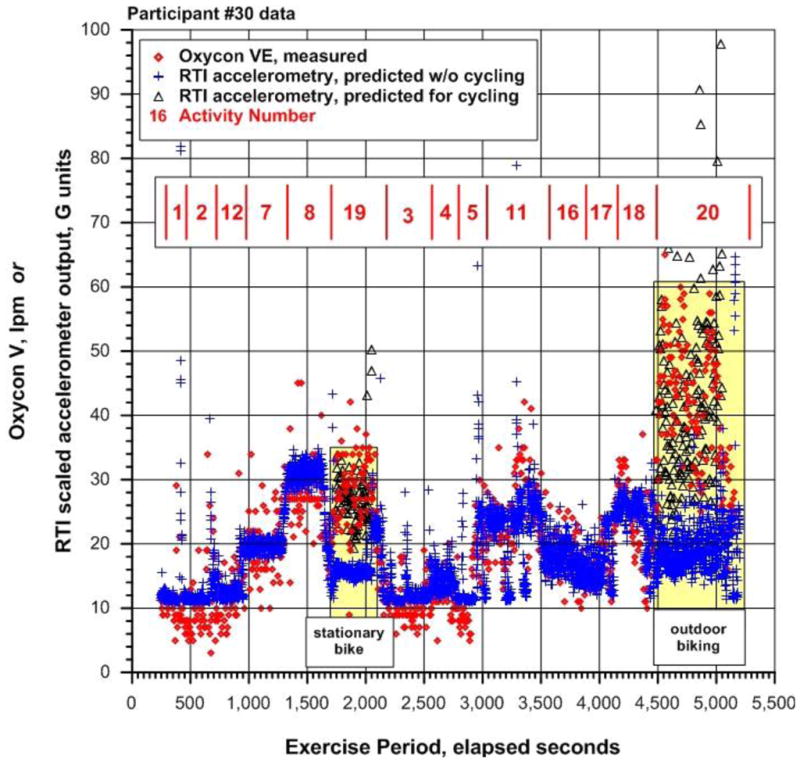
Example of Measured V for Participant #30 across selected scripted activities, illustrating the consistency of the ACCEL variable in predicting ventilation volume, and the potential biases if cycling was (black △) or was not (blue
 ; see color in online version only) identified a prior to define the appropriate regression to characterize the actual, measured V (
 ).
).