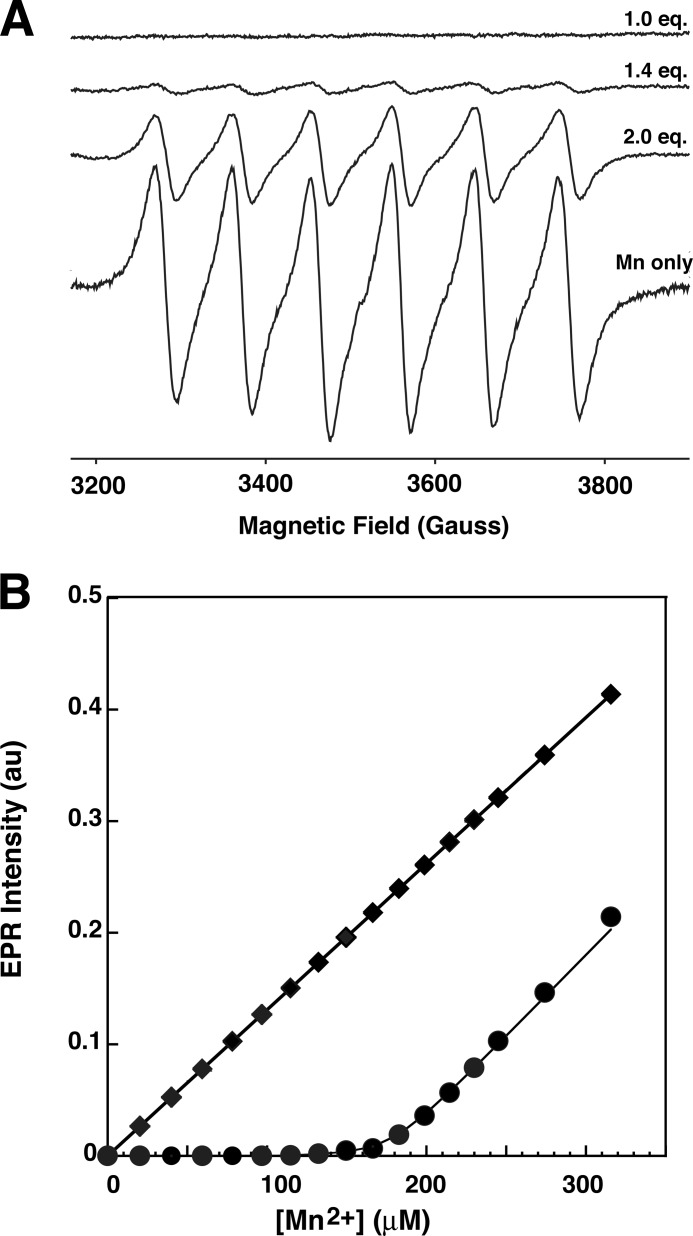
FIGURE 6.
Room temperature EPR analysis of Mn2+ binding. A, representative room temperature continuous wave X-band EPR spectra from samples containing 100 μm of HiLpxH and the appropriate concentration of MnCl2 to yield 1 eq of Mn2+, 1.4 eq of Mn2+, and 2.0 eq of Mn2+. For a comparison, an EPR spectrum from a control sample containing only buffer and MnCl2 at the same concentration as 0.6 Mn2+ eq. B, double integrated intensity of free (hexoaqua) Mn2+ EPR signal as a function of Mn2+ concentration for the room temperature titration experiment (circles) and a control titration experiment without the protein present (squares). Line represents least squares fit using a two-site binding model.

