FIGURE 1.
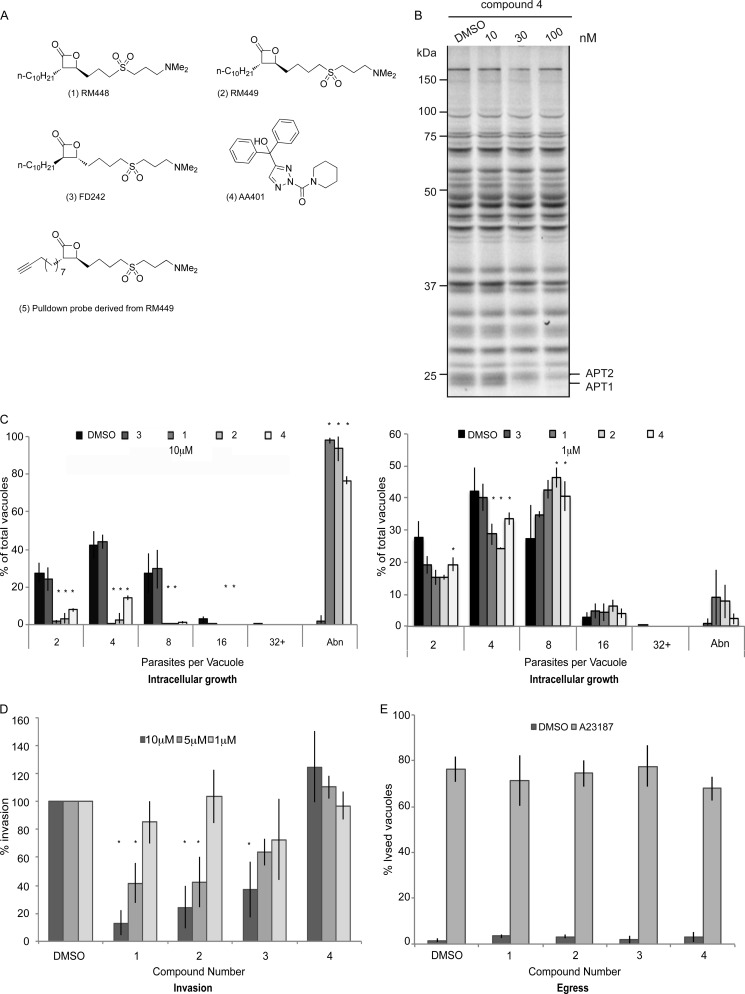
Human APT1 inhibitors disrupt the lytic cycle of apicomplexan parasites. A, structures of compounds used in this study. Compounds 1–3 and 5 are β-lactones, whereas compound 4 is a triazole urea. Compound 3 is the enantiomer of compound 2 and has reduced hAPT1 binding efficiency in biochemical assays where recombinant hAPT1 is the substrate (47, 48). All compounds target the active site serine of hAPT1 to inhibit the enzyme. Inhibition by the β-lactones is temporary as the inhibitor hydrolyzes the enzyme, whereas inhibition by the triazole urea is more stable. B, gel of activity-based pulldown using FP-Rh ABPP probe (59) shows 4 inhibition of APT activity after 30 min of treatment. C, left, intracellular growth of T. gondii treated with 10 μm hAPT1 inhibitors over 24 h showed a severe defect. Parasites were allowed to invade host cells and then were treated for the duration of the experiment. Right, intracellular growth of T. gondii treated with 1 μm hAPT1 inhibitors over 24 h showed little growth defect. Parasites were allowed to invade host cells and were then treated for the duration of the experiment. Samples were then fixed and stained with α-GAP45 to allow quantification of the number of parasites per vacuole. Those with morphological defects that could not be counted were classified as abnormal (Abn). D, extracellular parasites treated with inhibitor compounds or with DMSO were tested for invasion efficiency following 30 min of treatment with inhibitors. Infected cultures were washed and incubated for 24 h before fixation and counting of the number of vacuoles per field. Treatment with 10 and 5 μm β-lactone inhibitors led to a significant reduction in invasion. In contrast, compound 4 caused a slight increase in invasion at higher concentration, although this was not statistically significant. E, induced egress of tachyzoites from host cells by treatment with the calcium ionophore A23187 was not affected by pretreatment for 30 min with 10 μm inhibitors compared with DMSO. Lysed versus intact vacuoles were quantified. The results presented correspond to three independent biological experiments, and values are represented as mean ± S.D. (error bars).

