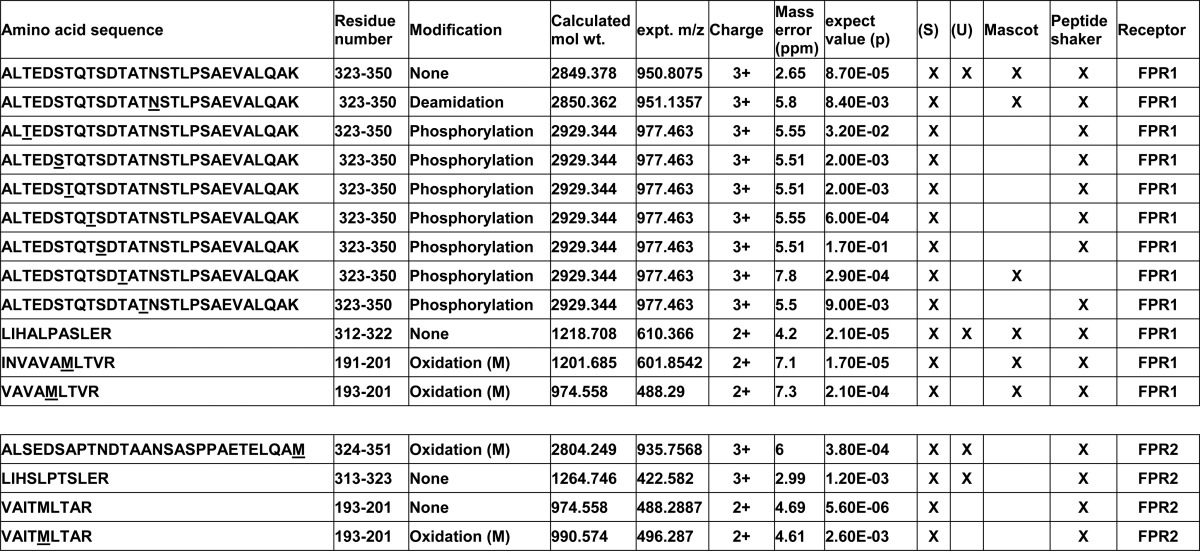
TABLE 2.
FPR1 and FPR2 peptides with modifications from stimulated and unstimulated neutrophils
The protein bands shown in Fig. 6 were excised from gels, digested with porcine trypsin, and subjected to LC/MS/MS mass analysis as described under “Experimental Procedures.” m/z data were analyzed by MASCOT and Peptide Shaker using 25 ppm for MS and MS/MS ion mass tolerance. The left column shows the identified peptides with residue modifications underlined. The upper set is from FPR1, and the lower set is from FPR2. Each subsequent column shows the residue sequence numbers, type of modification, calculated molecular weights, measured experimental m/z ratios, charge, ppm mass error, p values, fractions from which the data were derived, and the analysis program used.