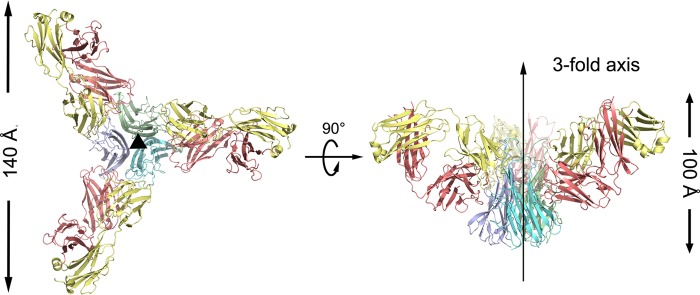
FIGURE 1.

Overall structure of the TNFα-Adalimumab Fab complex. The TNFα-Adalimumab Fab complex is shown as ribbon diagrams in two orientations: top view, looking down the crystallographic 3-fold symmetry axis; side view, with the crystallographic 3-fold axis vertical (middle). The central TNFα molecules are colored green, blue, and cyan, respectively; the light chain and heavy chain of the Adalimumab Fab are colored yellow and red, respectively.
