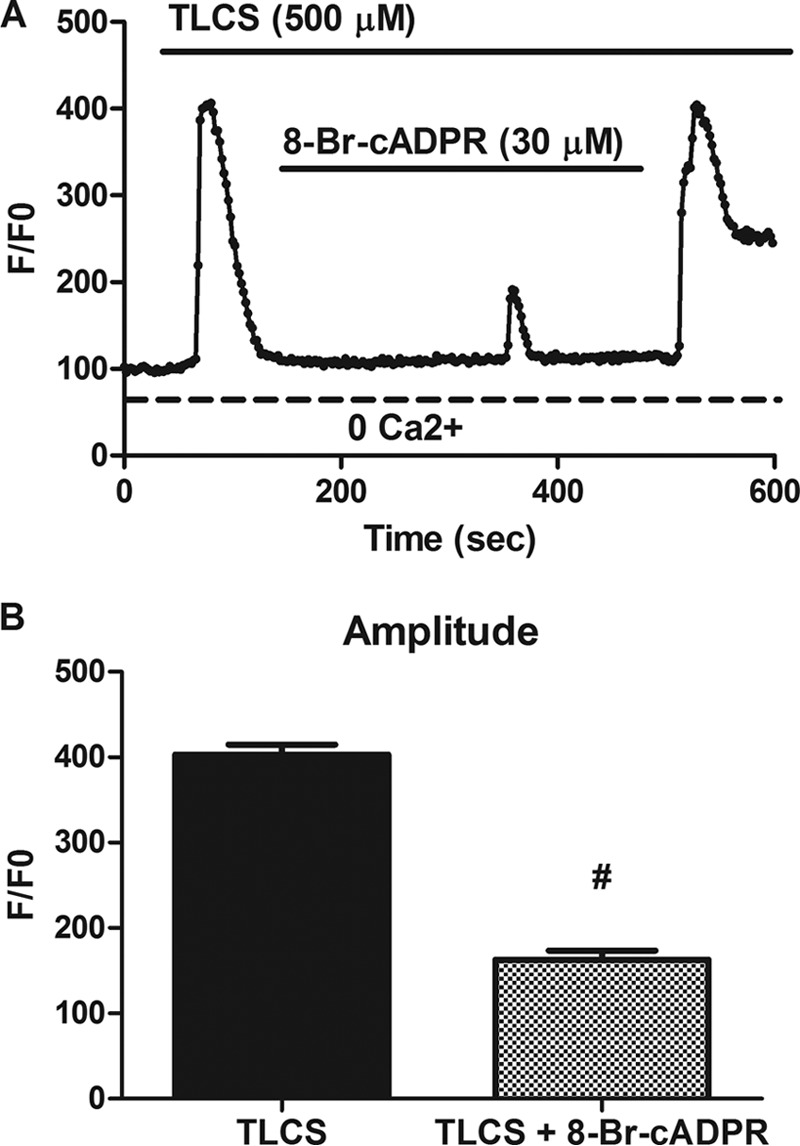
FIGURE 3.

Bile acid-induced Ca2+ signals are dependent on cADPR. A, representative Ca2+ signals observed in cells perifused with TLCS (500 μm) with or without the cADPR inhibitor 8-Br-cADPR (30 μm). B, amplitude of the Ca2+ signal represented as normalized fluorescence. Data were obtained from three separate days of experimentation (n = 50–60 cells/condition). #, p < 0.05 compared with TLCS alone.
