

Background: Purine metabolism in adipose tissue is largely unknown.
Results: Adipose tissue has abundant xanthine oxidoreductase activity. Uric acid is secreted from adipose tissues and cells, and the secretion is augmented in obese mice.
Conclusion: Adipose tissue can secrete uric acid in mice.
Significance: Dysfunction of obese adipose tissue could be related to overproduction of uric acid.
Keywords: Adipocyte, Adipose Tissue Metabolism, Metabolic Diseases, Obesity, Uric Acid
Abstract
Obesity is often accompanied by hyperuricemia. However, purine metabolism in various tissues, especially regarding uric acid production, has not been fully elucidated. Here we report, using mouse models, that adipose tissue could produce and secrete uric acid through xanthine oxidoreductase (XOR) and that the production was enhanced in obesity. Plasma uric acid was elevated in obese mice and attenuated by administration of the XOR inhibitor febuxostat. Adipose tissue was one of major organs that had abundant expression and activities of XOR, and adipose tissues in obese mice had higher XOR activities than those in control mice. 3T3-L1 and mouse primary mature adipocytes produced and secreted uric acid into culture medium. The secretion was inhibited by febuxostat in a dose-dependent manner or by gene knockdown of XOR. Surgical ischemia in adipose tissue increased local uric acid production and secretion via XOR, with a subsequent increase in circulating uric acid levels. Uric acid secretion from whole adipose tissue was increased in obese mice, and uric acid secretion from 3T3-L1 adipocytes was increased under hypoxia. Our results suggest that purine catabolism in adipose tissue could be enhanced in obesity.
Introduction
Uric acid is a product of metabolic breakdown of purine nucleotides. In humans, uric acid is the final oxidation product of purine catabolism (1). Elevated serum uric acid (hyperuricemia) is closely associated with visceral fat accumulation (2–4) and various metabolic disorders, such as glucose intolerance, elevated blood pressure, dyslipidemia, and atherosclerotic cardiovascular diseases, conceptualized as metabolic syndrome (5–10). The level of serum uric acid is determined by a balance between purine dietary uptake and production and excretion of uric acid. It is thought that uric acid is mainly produced in the liver and excreted through the urinary tract. However, there is little or no information about purine metabolism in various tissues, especially purine production.
Our group has reported previously the presence of low uric acid clearance in obese subjects relative to non-obese subjects (11). Among obese subjects, subjects with visceral fat obesity showed higher urinary urate excretion compared with those with subcutaneous fat obesity (12). On the basis of the above data, it seems that visceral fat obesity is relatively associated with overproduction-type hyperuricemia. Furthermore, we reported recently that reduction in visceral fat is associated with significant falls in serum uric acid level and that both serum adiponectin concentration and the visceral fat area were correlated significantly with the serum uric acid level (3). These results suggest the possible involvement of excess visceral fat per se in purine and uric acid metabolism.
Xanthine oxidoreductase (XOR)2 is an enzyme known to catalyze purines, such as xanthine and hypoxanthine, to uric acid. XOR is also a pharmacological target of the antihyperuricemic agents allopurinol and febuxostat. Recently, Cheung et al. (13) reported that XOR plays a role in adipocyte differentiation. In that report, Xor mRNA expression was elevated in adipose tissue of obese mice. However, to date, there has been no study to compare the enzymatic activity of XOR in adipose tissues and other tissues and analyze uric acid production in obese adipose tissues.
The aim of this study was to clarify a role of adipose tissue for production of uric acid and investigate the change with obesity, with a special focus on XOR. We demonstrate for the first time, using mouse models, that adipose tissue produces and secretes uric acid through XOR and that the production of uric acid is augmented in obesity.
EXPERIMENTAL PROCEDURES
Animals and Experimental Protocol
Male B6.V-Lepob/J (ob/ob) and their respective lean control male C57BL/6J (C57) mice were purchased from Charles River Laboratories (Charles River Japan, Inc., Yokohama, Japan). In a XOR tissue distribution analysis and tissue uric acid content analysis, 8-week-old male C57 and ob/ob mice were sacrificed after 4-hour fasting (n = 4 each). In febuxostat studies, 8-week-old male C57 and ob/ob mice were treated with or without febuxostat for 3 weeks (n = 6 each). Febuxostat is known as a non-purine selective inhibitor of XOR that has no effect on several enzymes in purine and pyrimidine metabolism (14). Mice of the febuxostat group were treated with febuxostat, which was added to drinking water (50 mg/liter; the dose was used on the basis of a previous report (15)). The dose of febuxostat was 6–8 mg/kg/day for C57 mice and 3–7 mg/kg/day for ob/ob mice. Mice of the vehicle group were provided with tap water. Samples of blood and tissues were obtained at the age of 11 weeks after 4-hour fasting. For studies on diet-induced obesity (DIO) mice (16), C57 male mice were purchased from CLEA Japan, Inc. (Tokyo, Japan). At 6 weeks of age, mice were randomly divided into two groups (n = 8 each). Mice of the DIO group were a fed high-fat/high-sucrose diet (F2HFHSD, Oriental Yeast Co., Tokyo, Japan), whereas mice of the control group were fed a regular diet (CRF-1, Oriental Yeast Co.) for 16 weeks. All mice were sacrificed at the age of 22 weeks after 4-hour fasting. Mice were kept in rooms set at 22 °C with a 12–12 h dark-light cycle (light cycle, 8 a.m. to 8 p.m.). All experimental protocols described in this report were approved by the Ethics Review Committee for Animal Experimentation of the Osaka University School of Medicine.
All blood samples were immediately mixed with 100 μm allopurinol to avoid XOR enzyme reactions in collected blood, and heparinized plasma was prepared by centrifugation for 20 min at 2300 × g at 4 °C. Plasma (10 μl) was added to 100 or 200 μl of a mixed solution of acetonitrile and methanol. This solution was mixed thoroughly on a vortex mixer for 5 s and centrifuged for 15 min at 20,400 × g at 20 °C. The supernatants were used for measurement of the uric acid level. Tissue samples (liver, 50 mg; Mes WAT, 100 mg; Epi and Sub WAT, 250 mg) were homogenized in 1 ml of 0.2 m perchloric acid and centrifuged at 20,000 × g for 15 min at 4 °C. The supernatants were filtered through a 0.22-μm filter (Amicon Ultrafree-MC UFC30GV00, Merck KGaA, Darmstadt, Germany), before measurement of the uric acid level.
Cell Culture
All cells were maintained at 37 °C in a humidified atmosphere of 5% CO2. 3T3-L1 and AML12 cells were obtained from the ATCC. 3T3-L1 cells were maintained in DMEM with 4.5 g/liter glucose, 100 units/ml penicillin, 100 μg/ml streptomycin, and 10% FBS, and differentiated as described previously (17). 3T3-L1 cells that were maintained 2 days after reaching confluence were used as preadipocytes, and 3T3-L1 cells on day 8 after differentiation were used as mature adipocytes. AML12 cells were maintained in DMEM/Ham's F12 medium supplemented with 10 μg/ml insulin, 5 μg/ml transferrin, 6.7 ng/ml selenium, 40 ng/ml dexamethasone, 100 units/ml penicillin, 100 μg/ml streptomycin, and 10% FBS.
Isolation, culture, and differentiation of stromal vascular cells (SVCs) were performed as described previously (18). Briefly, subcutaneous adipose tissues (inguinal region) were dissected out from 8-week-old C57 male mice, and SVCs were obtained by using a collagenase digestion procedure. Adipose tissues were incubated with digestion medium (DMEM containing 1 mg/ml type II collagenase (C6885, Sigma-Aldrich Co., St. Louis, MO)) for 60 min in a shaking water bath at 37 °C. After filtration and centrifugation, the pellet SVCs were seeded in 6-well plates with collagen I (Asahi Glass Co., Tokyo, Japan) and cultured until confluence in culture medium (DMEM containing 10% FBS and 200 μm ascorbic acid). Two days after confluence (day 0), the medium was switched to differentiation medium (culture medium plus 5 μm pioglitazone, 0.25 nm dexamethasone, 0.5 mm 3-isobutyl-1-metyl-xanthin, and 5 μg/ml insulin). Two days later, the differentiation medium was switched to maintenance medium (culture medium plus 5 μg/ml insulin). At day 8, SVCs were differentiated into adipocytes (Fig. 4A). Isolated hepatocytes were obtained from mice by the two-step perfusion collagenase method (19). Briefly, liver of 8-week-old C57 male mice was perfused in situ through the portal vein with liver perfusion medium (Invitrogen) at 37 °C for 10 min. Then it was perfused with liver digestion medium (Invitrogen) at 37 °C for 15 min. Then the liver was excised, transferred to a dish, and suspended. The resulting cell suspension was filtered and centrifuged at 50 × g for 3 min. Precipitated cells were used as hepatocytes. The viability of the isolated hepatocytes was more than 85%, as determined by trypan blue exclusion test. The hepatocytes were plated at density of 1.0 × 10⁶ cells in 6-well plates with collagen I in DMEM with 1.0 g/liter glucose containing 100 units/ml penicillin, 100 μg/ml streptomycin, and 250 ng/ml amphotericin B. After a 4-h attachment period, the cells were used for experiments.
FIGURE 4.
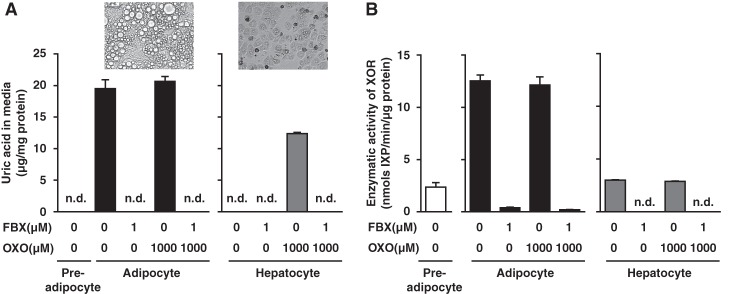
Primary mature adipocytes from mice produce and secrete uric acid via XOR. Shown are uric acid levels in culture medium (A) and XOR activity (B) in cell lysates of primary preadipocytes, mature adipocytes, and hepatocytes isolated from 8-week-old C57 male mice treated with or without FBX and/or oxonate (OXO) (n = 3 each). SVCs at 2 days after confluence were preadipocytes, and differentiated adipocytes derived from SVCs (day 8) were primary mature adipocytes. Photographs are representative images of primary mature adipocytes and hepatocytes. The medium was changed, and compound was added for 24 h prior to harvest. Data are mean ± S.E. n.d., not detected.
All cells were maintained in DMEM with 10% FBS and treated with the indicated concentrations of either febuxostat dissolved in DMSO or oxonic acid (Tokyo Chemical Industry Co., Tokyo, Japan) dissolved in sodium hydroxide. The cells were harvested after 24-h treatment, and the culture media were analyzed for uric acid. In the hypoxia study (Fig. 6, C and D), cells were cultured in a multigas incubator (MCO-5M, Panasonic, Tokyo, Japan) for 24 h under 1% or 10% O2. The culture medium (100 μl) was mixed with 400 μl of methanol, 100 μl of chloroform, and 300 μl of Milli-Q water, and the samples were thoroughly mixed and centrifuged at 20,000 × g for 10 min. The upper aqueous layer was dehydrated with a vacuum dryer, dissolved in 100 μl of 74 mm phosphate buffer (pH 2.2), filtered through a 0.22-μm filter, and subjected for measurement of uric acid. Uric acid was diluted with DMEM and 10% FBS to generate a series of standard solutions (10–3000 μg/dl), and those were handled in the same way.
FIGURE 6.

High production and secretion of uric acid in obese adipose tissues. A, uric acid content in tissues of C57 and ob/ob (ob) mice (n = 4 each). B, uric acid in culture media collected from ex vivo organ cultures of whole adipose tissues. Epi WAT, Mes WAT, and Sub WAT were obtained from 8-week-old C57 and ob male mice treated with or without febuxostat (FBX) (n = 4 each). Aliquots of media were collected at the indicated times and analyzed for uric acid. Shown are changes in uric acid in culture media (C) and XOR activity (D) in cell lysates of 3T3-L1 adipocytes following exposure to 20, 10, or 1% O2 for 24 h and treated with or without FBX (n = 3 each). The condition under 20% O2 was a normoxic control condition. The culture medium was changed, and compound was added for 24 h prior to harvest. Data are mean ± S.E. *, p < 0.05; **, p < 0.01; ***, p < 0.001; †, p < 0.05; †††, p < 0.001 versus the dimethyl sulfoxide group of C57 mice. #, p < 0.05; ##, p < 0.01 versus the FBX group of C57 mice. ‡‡‡, p < 0.001 versus the FBX group of ob mice. n.d., not detected.
Knockdown of XOR in 3T3-L1 Mature Adipocytes
On day 7 after the induction of differentiation, 3T3-L1 adipocytes were transfected with siRNA for XOR (XOR siRNA, catalog no. 132003 MSS238716, Invitrogen) using Lipofectamine RNAiMAX reagent (Invitrogen) according to the protocol recommended by the manufacturer. The transfected cells were incubated for 48 h, and then the cells were used for experiments. Allstars negative control siRNA (Qiagen, Valencia, CA) was used as a control.
Organ Culture of Mouse Adipose Tissue
Adipose tissue organ culture was prepared as described previously (20, 21). Briefly, Epi WAT, Mes WAT, and Sub WAT were obtained from 8-week-old C57 and ob/ob male mice (n = 4 each). The respective mean wet weights of the tissues (± S.E.) were as follows: Epi WAT, 185.8 ± 7.9 and 1848.4 ± 49.3 mg; Mes WAT, 164.8 ± 19.0 and 1059.8 ± 50.9 mg; and Sub WAT, 190.0 ± 8.0 and 2106.6 ± 53.7 mg. Each tissue was placed onto a 3-cm dish filled with 1 ml DMEM and 10% FBS. The whole tissues were minced into small pieces. The medium was removed and washed with 1 ml of calcium- and magnesium-free PBS, incubated at 37 °C in 5% CO2 with 1 ml DMEM and 10% FBS containing 1 μm febuxostat dissolved in dimethyl sulfoxide or dimethyl sulfoxide only. After 1- to 6-hour culture, the culture medium was collected and subjected to measurement of uric acid levels by HPLC.
Measurement of Uric Acid Level
Plasma levels of uric acid were measured by LC/MS/MS. The chromatographic system was Agilent 1100 (Agilent Technologies, Inc., CA) using a ZIC-pHILIC column (Merck KGaA). The column oven was maintained at 30 °C, the flow rate was 0.8 ml/min, and the injection volume was 5 μl. Separation was performed using a gradient solvent system (solvent A, water; solvent B, 100 mm ammonium acetate; solvent C = acetonitrile). The gradient condition was as follows: solvent B was maintained to 5%. The gradient started at 4% solvent A and increased to 45% from 0.5–5 min, which was held until 5.5 min. The column was reconditioned with the initial condition for 3.5 min. Electrospray mass spectrometric analyses were performed on an API 3000 (AB Sciex) equipped with a TurboIonSpray source operated in multiple reaction monitoring under negative ion mode. The multiple reaction monitoring transition pairs were 166.965 > 123.5 for uric acid and 168.925 > 124.8 for uric acid-1, 3-15N2. For internal standard solution, 400 or 800 nm of uric acid-1, 3-15N2 solution diluted with water was used. For standard solutions, 10–100,000 nm of uric acid solution diluted with a mixed solution of acetonitrile and methanol was used. All samples and standards were mixed with the same volume of internal standard solution, and the mixture was subjected to LC/MS/MS analysis. Calibration curves on the basis of internal standard calibration were obtained by weighted (1/x, x = concentration) linear regression for the peak area ratio of the analyte to the internal standard against the analyte concentration. The concentrations of the analyte in unknown samples were obtained from the regression curve.
Uric acid contents in tissues, culture media, or dialysates were measured by the HPLC-UV method (22). The chromatographic system was a NanoSpace SI-2 (Shiseido, Tokyo, Japan) using a Capcellpak C18 MGIII column (Shiseido). Separation was performed at room temperature using a gradient solvent system (solvent A, 74 mm phosphate buffer (pH 2.2); solvent B, 50% methanol/37 mm sodium phosphate buffer (pH 2.2)). The gradient conditions were as follows. The initial percentage of solvent B was 0%, which was increased to 10% in 8 min. To clean up the column, the percentage of solvent B was increased to 100% in 2 min, maintained for 3 min, and then lowered to 0% in 0.1 min, after which it was kept constant for 15 min to re-equilibrate the column prior to the next injection. The flow rate was set at 200 μl/min, and the injection volume was 10 μl. Uric acid was detected at A284 nm. For standard solution, 3–3000 μg/dl of uric acid solution diluted with 0.2 m perchloric acid or saline was used. For the measurement of the uric acid level in culture media, other standard solutions described in the above sections were used. The sample absorbance area under the curve was calculated, and the concentration was calibrated by standard linear regression. Uric acid contents were given by multiplying the concentrations by the sample volume.
Fractionation of Mouse Adipose Tissue
Epi WAT, Mes WAT, and Sub WAT from 8-week-old C57 male mice were fractionated as described previously (23). Adipose tissues were minced in Krebs-Ringer bicarbonate HEPES buffer, which contained 120 mmol/liter NaCl, 4 mmol/liter KH2PO4, 1 mmol/liter MgSO4, 1 mmol/liter CaCl2, 10 mmol/liter NaHCO3, 30 mmol/liter HEPES, 20 μmol/liter adenosine, and 4% (w/v) bovine serum albumin (Calbiochem, San Diego, CA). Tissue suspensions were centrifuged at 500 × g for 5 min to remove erythrocytes and free leukocytes. Collagenase was added to a final concentration of 2 mg/ml and incubated at 37 °C for 30 min under continuous shaking. The cell suspension was filtered through a 250-μm filter and then spun at 300 × g for 1 min to separate floating mature adipocyte fraction (MAF) from the stromal vascular cell fraction (SVF) pellet. The fractionation and washing procedures were repeated twice with Krebs-Ringer bicarbonate HEPES buffer. Finally, both fractions were washed with PBS and subjected to mRNA analysis.
Quantification of mRNA Levels
Total RNA was isolated from mouse tissues by using RNA STAT-60 (Tel-Test, Inc., Friendswood, TX) according to the protocol supplied by the manufacturer. The quality and quantity of total RNA were determined by using an ND-1000 spectrophotometer (Nano Drop Technologies, Wilmington, DE). First-strand cDNA was synthesized from 160 ng of total RNA using a Transcriptor First Strand cDNA synthesis kit (Roche Applied Science). Real-time quantitative PCR amplification was conducted with the LightCycler 1.5 (Roche Applied Science) using Light Cycler-FastStart DNA Master SYBR Green I (Roche Applied Science) according to the protocol recommended by the manufacturer. The sequences of primers used for real-time PCR were as follows: Xor, 5′-TCTGCCCTCTAACACAGCCT-3′ (forward) and 5′-TGACAGCGACCTCACTCATC-3′ (reverse) and Uox, 5′-GGTGGAGCAGATGAGAAACG-3′ (forward) and 5′-GGAACCCTTCAAACCCAGAC-3′ (reverse).
Western Blot Analysis
Tissue lysates (5 μg of protein) were resuspended in Laemmli buffer. Proteins were separated by SDS-PAGE, transferred to nitrocellulose membranes, blocked with 5% nonfat milk, washed with TBS-T (10 mm Tris-HCl, 100 mm NaCl, and 0.02% Tween 20), and incubated overnight at 4 °C with the primary antibodies. The antibody against XOR was diluted 1:1000 (catalog no. sc-20991, Santa Cruz Biotechnology, Inc., Santa Cruz, CA). Membranes were washed with TBS-T and incubated with anti-rabbit IgG horseradish peroxidase-conjugated secondary antibodies (catalog no. NA934, GE Healthcare, diluted 1:4000). Proteins were visualized by enhanced chemiluminescence and quantified by densitometry.
XOR Activity Measurement
XOR activity in tissue homogenates and cell lysates was determined using a fluorometric assay measuring the conversion of pterin to isoxanthopterin (24–26). Tissues or cultured cells were homogenized in 50 mm Tris-HCl (pH 7.5), 0.1% Triton X-100, and complete protease inhibitor mixture (Roche Applied Science) and centrifuged at 20,000 × g for 15 min at 4 °C. Protein concentrations were determined by using the BCA protein assay (Thermo Fisher Scientific Inc., Waltham, MA). To measure xanthine oxidase (XO) activity, lysates were incubated under aerobic condition at room temperature for 30 min with 25 μm pterin, and fluorescence intensity at excitation/emission = 355 nm/405 nm was measured every 5 min. To measure the activities of both XO and xanthine dehydrogenase (XDH) (XOR activity), lysates were incubated with 25 μm pterin and 200 μm methylene blue under the same condition. The reaction rate was determined from the slope of the intensity-versus-time plots. For calibration, the step change in fluorescence intensity upon addition of a standard concentration (0.1–30 μm) of isoxanthopterin was measured. Values are expressed as nanomoles isoxanthopterin/minute/microgram protein.
Microdialysis Studies
The effects of ischemia reperfusion injury on uric acid level in Epi WAT and blood were measured by microdialysis (27, 28). In all microdialysis studies, 8-week-old C57 male mice were used after 4-hour fasting. During the experiments, mice were anesthetized and warmed with heating pads to maintain body temperature. The microdialysis probes were custom-made (150 mm × 0.2 mm inner diameter, 70,000 molecular mass cut-off), and their structures are displayed in Fig. 5, A and B. The recovery rate of uric acid in the probes was calculated in preliminary in vitro experiments (single-lumen probe, 67.6 ± 5.9%; double-lumen probe, 66.0 ± 15.8%; mean ± S.D.). During dialysis, the probe and catheter were connected to a microinfusion pump (CFV-3100, Nihon Kohden, Tokyo, Japan) and perfused with saline (2 μl/min).
FIGURE 5.

Adipose tissue produces and secretes uric acid via XOR in vivo. A and B, schematic of the microdialysis probes. A, a single-lumen probe was used in the Epi WAT study. This probe was implanted into Epi WAT using a syringe needle. I.D., inner diameter. B, a double-lumen probe was used in the intravenous study. C–F, microdialysis analysis of Epi WAT. C, uric acid level in dialysate through the microdialysis probe planted in Epi WAT of FBX- and Vehi-treated C57 mice (n = 8, each). D, schematic of the experiment. C57 mice were treated with febuxostat (FBX) or vehicle (Vehi) (n = 4 each) and implanted with single-lumen probes in both Epi WAT. After the collection of steady-state dialysates (0 to 30 min), surgical ischemia of the right Epi WAT was induced, and dialysates were collected during the ischemia period (30–60 min). E, after the collection of all fractions, ischemia of the right Epi WAT was confirmed by intravascular injection of 100 μl of 0.5% Evans Blue. F, uric acid levels in each fractions of dialysate. G and H, microdialysis study using an intravenous probe. G, schematic of the experiment. C57 mice were implanted with double-lumen probes in a peripheral vein. After the collection of steady-state dialysates, surgical ischemia in both Epi WAT was induced, and dialysates were collected during ischemia. Subsequently, reperfusion was performed, and dialysates were collected during the reperfusion period (60–90 min). Control mice were sham-operated (n = 9). H, changes in uric acid in dialysate. Each value of each individual mouse was normalized to the value at 0–10 min, respectively. Values are expressed as mean ± S.E. *, p < 0.05; **, p < 0.01; ***, p < 0.001; #, p < 0.05; ##, p < 0.01; ###, p < 0.001 versus vehicle control group.
In Epi WAT studies, mice of the febuxostat group were given a single oral administration of 6 mg/kg febuxostat (0.6 mg/ml suspended in tap water), whereas mice of the vehicle group were given equal amount of tap water (n = 4 each). After 2 h, single-lumen probes (Fig. 5A) were implanted into both Epi WATs. After a 60-min equilibration period, fractions were collected every 10 min. After the end of the third fraction period, ischemia of the right Epi WAT was induced by surgical occlusion of the right testicular artery and vein, and the following three fractions were collected.
In intravenous studies, mice of the ischemia/reperfusion group and control group (n = 9, each) were injected intravenously with 1000 units/kg heparin (Novo-Heparin, Mochida Pharmaceutical Co., Tokyo, Japan) to prevent the adhesion of blood clots to the probe. Double-lumen probes (Fig. 5B) were introduced from the right external jugular vein up to 15 mm. It was considered that the head of the probe was located near the superior vena cava. After a 60-min equilibration period, fractions were collected every 10 min. At the end of the third fraction period, mice of the ischemia/reperfusion group were subjected to bilateral ischemia of Epi WAT by reversible occlusion of the testicular artery and vein using vascular clips, and the following three fractions were collected. Then, the clip was removed to initiate reperfusion of Epi WAT, and three other fractions were collected. Mice of the control group underwent a sham operation. The collected 10 μl of each dialysate was used for the measurement of uric acid.
Statistical Analysis
Results were expressed as mean ± S.E. Repeated measure-based parameters were analyzed using two-way analysis of variance test with repeated measures followed by unpaired Student's t test for individual pairs. Differences on the basis of febuxostat concentrations were analyzed by Kruskal-Wallis test. Other comparisons were conducted using unpaired Student's t test or one-way analysis of variance followed by Dunnett's or Tukey's post hoc test. In all cases, differences were considered significant when p < 0.05. All analyses were performed using the JMP Statistical Discovery Software 9.0 (SAS Institute, Cary, NC).
RESULTS
Obese Mice Have Hyperuricemia, and XOR Inhibitor Treatment Reduces Plasma Uric Acid Levels of Obese Mice
At first, we analyzed plasma uric acid levels in obese mice and the effect of febuxostat, a XOR inhibitor (Fig. 1). Febuxostat is a new drug used for the treatment of gout and hyperuricemia on the basis of inhibition of XOR-mediated production of uric acid during purine catabolism. As reported previously (13, 29), plasma uric acid level in 11-week-old ob/ob mice was significantly higher than in age-matched control C57BL/6J (C57) mice (Fig. 1A). Treatment with febuxostat for 3 weeks decreased the level of plasma uric acid in ob/ob mice but had no effect in control mice. Treatment with febuxostat had no effect on body weight, food intake, and Epi WAT weight in control and ob/ob mice (data not shown). The decrease in plasma uric acid level by febuxostat demonstrated that the high plasma uric acid level was substantially caused by XOR-mediated overproduction of uric acid.
FIGURE 1.

High plasma uric acid levels in obese mice and their suppression by XOR inhibitor. Shown are the plasma uric acid level (A) and XO and XOR (XO + XDH) activities (B) in tissue homogenates of C57 and ob/ob (ob) mice, treated with febuxostat (FBX) or vehicle (Vehi) for 3 weeks (n = 6 each). Shown are the plasma uric acid level (C) and XO and XOR activities (D) in tissue homogenates of control and DIO mice (control, n = 8; DIO, n = 7). Data are mean ± S.E. *, p < 0.05; **, p < 0.01; ***, p < 0.001.
In mammals, XOR can exist in two enzymatic forms: XDH (EC 1.1.3.204) and XO (EC 1.1.3.22). XDH utilizes NAD+ as an electron acceptor, whereas XO utilizes O2 as an electron acceptor (30). To examine the effect of obesity on XOR enzymatic activity and confirm the effect of febuxostat, we measured XO and XOR activities (the combined activity of XO and XDH) in liver and adipose tissue (Fig. 1B). In the liver of ob/ob mice, XO activities were significantly higher, but XOR activities tended to be higher (p = 0.0672) relative to those of control mice. On the other hand, in Epi WAT of ob/ob mice, both XO and XOR activities were markedly higher than those of control mice. Treatment with febuxostat inhibited both XO and XOR activities in the liver and Epi WAT of ob/ob and control mice. The increased XO and XOR activities in the Epi WAT of ob/ob mice suggested enhancement of purine catabolism in adipose tissue in obese mice.
We also analyzed plasma uric acid levels in DIO mice. In mice of the DIO group, which were fed a high-fat/high-sucrose diet for 16 weeks, the body weights were significantly heavier (data not shown) and the levels of plasma uric acid were significantly higher (Fig. 1C) than those in mice of control group. XO and XOR activities in the liver were significantly higher in DIO mice than in control mice. Furthermore, XO activities in Epi WAT tended to be higher (p = 0.0665), and XOR activities were significantly higher in DIO mice than in control mice (Fig. 1D). XO and XOR activities in adipose tissue were equivalent to those in the liver in both ob/ob and DIO mice (Fig. 1, B and D).
Adipose Tissue Is One of the Major Organs That Have Abundant Expression and Activities of XOR, and Obese Adipose Tissues Have Higher XOR Activities
In the above experiments, we demonstrated that XOR activity in Epi WAT were increased with obesity and that such an increase was suppressed following treatment with febuxostat. Xor gene expression in adipose tissue has been reported previously in only one study using microarray analysis, which demonstrated Xor expression in several tissues (13). Here, we conducted a comprehensive analysis of Xor gene expression, protein expression, and enzymatic activity in various tissues in ob/ob obese mice and control mice. The analyzed tissues included Epi WAT, Mes WAT, and Sub WAT (Fig. 2). In lean C57 mice, Xor mRNA expression levels were more abundant in Epi WAT and small intestine than in other tissues, whereas the levels in Mes WAT, Sub WAT, liver, lung, and heart ranked second to those in Epi WAT and the small intestine. Relatively low levels of Xor mRNA were detected in the brain, spleen, kidney, testis, colon, aorta, and muscle (Fig. 2A). These results indicate that adipose tissues are major organs that have abundant Xor mRNA expression. The Xor mRNA level in Mes WAT was significantly higher in ob/ob mice than in C57 mice. There were no significant differences in Xor mRNA levels in other tissues between ob/ob and C57 mice.
FIGURE 2.

Adipose tissue is one of the major organs that has an abundant XOR expression level and enzymatic activity, and obesity is associated with high XOR enzymatic activity in adipose tissues. A, Xor mRNA expression levels in various tissues of C57 and ob/ob (ob) mice. The Xor mRNA level in the livers of C57 mice was set at 1, whereas those in other tissues were set relative to the Xor mRNA levels in the livers of C57 mice. B, Western blot analysis of XOR protein in tissue homogenates obtained from C57 and ob mice (n = 3–4 pooled samples). C, quantitative analysis of relative XOR protein contents by Western blotting (n = 3–4 each). Data represent the fold change relative to C57 mice. D, tissue distribution of XO and XOR activities in C57 and ob mice. Data are mean ± S.E. *, p < 0.05; **, p < 0.01; ***, p < 0.001; n.d., not detected.
Next, we examined the protein expression levels of XOR using Western blotting. In the homogenates of liver, lung, small intestine, Epi WAT, Mes WAT, and Sub WAT obtained from C57 and ob/ob mice, relatively more abundant expression was detected (Fig. 2B). The quantitative analysis indicated that XOR protein levels of Mes WAT in ob/ob were significantly higher than that in C57 (Fig. 2C).
XO and XOR (XO + XDH) enzymatic activities were also measured by fluorometric assay using pterin substrate (24–26). In C57 mice, both XO and XOR activities were highest in the small intestine, followed by the liver, lung, Epi WAT, Mes WAT, and Sub WAT (Fig. 2D). These findings are almost consistent with those described in a previous study, although that study did not examine the activities in adipose tissue and skeletal muscle (31). Further analysis showed higher XO activities in Epi WAT, Mes WAT, heart, spleen, kidney, colon, and muscle (p < 0.05) and higher XOR activities in Epi WAT, Mes WAT, heart, and spleen (p < 0.05) of ob/ob than of C57 mice. We demonstrated for the first time that adipose tissue is one of the major organs to have abundant expression and activities of XOR in mice and that obese adipose tissues have higher XOR activities. These findings suggest that purine catabolism in adipose tissue is accelerated with obesity.
Mature Adipocytes Produce and Secrete Uric Acid via XOR
To identify which cell type preferentially contributed to the observed XOR levels, MAF and SVF were isolated from adipose tissues (Fig. 3A). Xor mRNA levels were markedly higher in the MAF of Epi WAT, Mes WAT, and Sub WAT compared with SVF.
FIGURE 3.

3T3-L1 mature adipocytes produce and secrete uric acid via XOR. A, Xor mRNA expression levels in MAF and SVF of Epi WAT, Mes WAT, and Sub WAT of 8-week-old C57 male mice (MAF, n = 8–9; SVF, n = 6). B, time course of uric acid accumulation in culture media and intracellular XOR activities during differentiation of 3T3-L1 cells. The indicated values represent those of the day after the induction of differentiation. Shown are uric acid levels in culture medium (C) and XOR activity (D) in cell lysates of 3T3-L1 preadipocytes, mature adipocytes, and AML12 hepatocytes treated with or without febuxostat (FBX) (n = 3 each). In both experiments, the medium was changed, and compound was added for 24 h prior to harvest. Shown are XOR activity in cell lysate (E) and uric acid levels (F) in culture media of 3T3-L1 mature adipocytes transfected with siRNAs. 3T3-L1 mature adipocytes were transfected with XOR-siRNA or control (Ctrl) siRNA on day 7, and XOR activity was measured on day 9. The medium was changed on day 9 and cultured for 12 or 24 h to measure the uric acid level. Data are mean ± S.E. *, p < 0.05; **, p < 0.01; ***, p < 0.001; n.d., not detected.
Next, we investigated whether mature adipocytes can produce and secrete uric acid. For this purpose, we examined the level of uric acid in culture medium of mouse 3T3-L1 adipocytes as well as the enzymatic activity of XOR in the cell lysates. We examined the accumulation of uric acid in medium per 24 h in 3T3-L1 cells each day after differentiation. Uric acid became detectable from day 1 after differentiation and increased in a time-dependent manner (Fig. 3B). Intracellular XOR activity also increased during differentiation up to day 29. In other experiments, the uric acid level in culture medium of 3T3-L1 mature adipocytes (day 8) was significantly higher than in that of preadipocytes (day 0) (Fig. 3C). Furthermore, the addition of febuxostat significantly decreased the uric acid level in culture medium, and the effect was dose-dependent. This decrement was associated with inhibition of intracellular XOR activity (Fig. 3D). These results suggest that 3T3-L1 mature adipocytes produce and secrete uric acid via XOR. In the culture medium of AML-12, which is the mouse hepatocyte cell line, accumulation of uric acid was also detected and suppressed by febuxostat in a dose-dependent manner (Fig. 3, C and D). To confirm XOR-dependent uric acid production from mature adipocytes, we performed XOR gene knockdown experiments using 3T3-L1 mature adipocytes. After 48 h of XOR siRNA transfection, XOR mRNA levels were decreased by an average of 57% (data not shown), and intracellular XOR activities were significantly decreased compared with those of control siRNA (Fig. 3E). From this point, transfected adipocytes were cultured for 12 and 24 h, and the accumulated uric acid in culture media was compared. The uric acid level in culture medium of XOR knockdown adipocytes was significantly lower than in that of control siRNA-transfected adipocytes (Fig. 3F). These results suggest that uric acid production from 3T3-L1 mature adipocytes depends on XOR activity.
We also measured uric acid levels in culture medium of primary SVCs (18) and primary hepatocytes (19) obtained from 8-weeks-old C57 male mice (after differentiation of SVCs into adipocytes). Adipocyte differentiation was confirmed by accumulation of lipid droplets. Uric acid levels in culture medium of primary mature adipocytes (day 8) were significantly higher than in that of primary preadipocytes (day 0) (Fig. 4A), although the addition of febuxostat abrogated the high level in mature adipocytes. In contrast, uric acid was not detected in medium of primary hepatocytes despite positive XOR activity. It is known that urate oxidase (EC 1.7.3.3) is abundantly expressed in the mouse liver to catalyze the oxidation of uric acid to allantoin (32). To prevent uric acid catabolism, we treated primary hepatocytes with oxonate, a urate oxidase inhibitor. Such treatment resulted in the accumulation of uric acid in medium, and such an increase was not associated with any change in XOR activity (Fig. 4B). Treatment with oxonate neither changed uric acid levels in culture media of primary adipocytes nor XOR activity in these cells. In Epi WAT, Mes WAT, and Sub WAT, Uox mRNA levels were extremely low, and no urate oxidase activities were observed (data not shown). Considered together, these results suggest that mature adipocytes produce and secrete uric acid via XOR, presumably, as well as hepatocytes.
Adipose Tissue Produces and Secretes Uric Acid in Vivo
Next, to test whether adipose tissue produces and secretes uric acid in vivo, we performed microdialysis experiments using mouse adipose tissue. Uric acid was detected in dialysate obtained from steady-state Epi WAT of C57 mice, and its level decreased significantly after treatment with febuxostat (Fig. 5, A and C).
Previous studies reported that ischemia-reperfusion injury accelerates purine nucleotide degradation and intracellular accumulation of oxypurines in various tissues (33–38). To identify whether the uric acid contained in dialysate was secreted from Epi WAT rather than from peripheral blood, we examined the effects of ischemia of Epi WAT. The experimental scheme is shown in Fig. 5D. Intravenous injection of Evans Blue dye confirmed the induction of ischemia in Epi WAT on the right side in each mouse (Fig. 5E). Ischemia resulted in a significant rise in uric acid level in dialysate of Epi WAT derived from the ischemic side (Fig. 5F, ■) compared with the lack of change on the control side (no ischemia, □). Furthermore, treatment of mice with febuxostat completely abrogated the rise in uric acid level during ischemia (Fig. 5F, ▵ versus ▴). These results indicate that ischemia increases regional production and secretion of uric acid in Epi WAT through XOR activity and that the source of the high uric acid levels is the adipose tissue rather than peripheral blood.
We next asked whether the ischemia-induced increase in uric acid secretion from Epi WAT results in increase of circulating uric acid level. For this purpose, intravenous microdialysis was performed, as shown in Fig. 5, B and G, and the effect of ischemia-reperfusion of Epi WAT was investigated. Because the dialysate through the intravenous probe reflects the concentrations of circulating metabolites, this method can analyze serial changes in circulating uric acid without withdrawal of blood samples. In mice of the ischemia-reperfusion group, uric acid levels in the dialysate increased during ischemia and increased significantly during the reperfusion period compared with of mice of the control group (Fig. 5H). These results suggest that the uric acid produced in Epi WAT has an impact on the elevation of circulating uric acid.
Production and Secretion of Uric Acid Is Augmented in Obese Adipose Tissue
Because XOR activity is elevated in obese adipose tissues (Figs. 1, B and D, and 2D), we compared the uric acid tissue contents in ob/ob and C57 mice (Fig. 6A). Uric acid contents in Mes WAT and Sub WAT were significantly higher in ob/ob mice than C57 mice. Next, to investigate the difference in the amount of uric acid secreted by adipose tissues between obese and lean mice, we performed organ culture experiments using various adipose tissues obtained from ob/ob and C57 mice. Whole adipose tissues from C57 and ob/ob mice were minced and incubated from 1–6 h, and uric acid accumulations in culture media were measured. As demonstrated in Fig. 6B, uric acid secreted by each adipose tissue of C57 and ob/ob mice was accumulated in medium during the experiments (Fig. 6B, ▴ and ■, respectively). At each time point, the accumulation of uric acid derived from each minced adipose tissue of ob/ob mice was significantly more than that of C57 mice. The high uric acid levels in both C57 and ob/ob mice were reduced following the addition of febuxostat (Fig. 6B, ▵ and □, respectively). Thus, these findings suggest that the secreted uric acid by whole adipose tissues is increased with obesity.
Recent studies have revealed that obese adipose tissues are locally hypoxic (39–41). Exposure of various cultured cells to hypoxia has been reported to increase endogenous XOR activity (42–44). On the basis of these studies, we examined the effects of hypoxia on the regulation of XOR enzymatic activity and uric acid production in adipocytes. In vitro experiments using 3T3-L1 mature adipocytes (day 8) exposed to 1% O2 for 24 h showed that uric acid accumulation into culture medium was significantly higher than that under normoxia (20% O2) (Fig. 6C). Exposure to 10% O2, which is a more moderate hypoxic condition, also increased uric acid accumulation significantly. Hypoxia also increased intracellular XOR activity (Fig. 6D). Under these conditions, febuxostat (i.e. blockade of XOR activities) completely canceled uric acid accumulation in the media (Fig. 6, C and D).
DISCUSSION
A XOR inhibitor, febuxostat, reduced plasma uric acid levels in ob/ob mice as well as XOR activities in Epi WAT (Fig. 1). These results suggest that XOR in adipose tissue and liver is the possible target of XOR inhibitors. On the basis of this finding, we examined the role of adipose tissue per se in the production of uric acid with a special focus on XOR. The results demonstrate for the first time that adipose tissue is a major organ that has abundant activity of XOR, similar to the small intestine, liver, and other organs (Fig. 2). Furthermore, mature adipocytes and adipose tissue produced and secreted uric acid (Figs. 3, 4, and 5). Obesity was associated with a further increase in XOR activity and uric acid secretion by adipose tissue (Figs. 1, 2, and 6).
What is the mechanism of augmented uric acid production in obese adipose tissue? One explanation may be related to hypoxia of obese adipose tissue. We and others have reported that obese adipose tissue is hypoxic and that hypoxia induces dysfunction of adipose tissue, such as dysregulation of adipocytokines and chronic low-grade inflammation (39–41, 45). Hypoxic-induced increase in XOR activity has been reported in various cultured cells (42–44). Consistent with these reports, we found that local tissue hypoxia up-regulated intracellular XOR activity and increased uric acid production by 3T3-L1 mature adipocytes (Fig. 6). Therefore, it is suggested that local hypoxia is a potential upstream factor responsible for increased uric acid production in obese adipose tissue. Previous reports showed that hypoxia up-regulates XOR activity at pre- and posttranslational levels (25, 43). In this study, the enzymatic activity of XOR was higher in Epi WAT and Sub WAT of ob/ob mice even though their mRNA and protein levels were not changed (Fig. 2, A, C, and D). Therefore, XOR activities in obese adipose tissues could possibly be increased, in part, by posttranslational regulation.
Another mechanism may relate to lipogenesis and/or lipolysis. Obese adipose tissue is characterized by active fatty acid synthesis (46). It is presumed that fatty acid synthesis is closely associated with de novo purine synthesis through the activation of the pentose phosphate pathway (47). Furthermore, XOR-null mice have a low serum level of fatty acid and lipid accumulation in mammary epithelium and renal tubules (13, 48, 49), suggesting a possible involvement of XOR in lipid homeostasis. In adipocytes, the pentose phosphate pathway is reported to be activated during fatty acids synthesis (50, 51). Our experiments using 3T3-L1 adipocytes showed an up-regulated secretion of uric acid during adipocyte differentiation that was accompanied by intracellular accumulation of triglyceride (Fig. 3B and data not shown). Therefore, it is possible that activation of the pentose phosphate pathway related to active synthesis of fatty acids may be associated with abundant activity of XOR, resulting in the production and secretion of uric acid. On the other hand, obesity is also associated with up-regulated lipolysis in adipose tissue (52). Evidence suggests that activation of lipolysis in adipocytes by β-adrenergic stimulation may be associated with turnover of cAMP, which is an intracellular messenger of catecholamines (53). Hydrolysis of cAMP yields AMP, which is the first substrate of the catabolic reaction of purine production. Therefore, lipolysis could also relate to uric acid production in obese adipose tissues. Thus, the high XOR activity and uric acid production by adipose tissue may relate to active lipid metabolism. Further research is required to elucidate these hypotheses.
The microdialysis experiments in mice provided new findings that surgical ischemia of adipose tissue increased local uric acid production and increased plasma uric acid levels. These data suggest that production of uric acid by adipose tissue can potentially increase circulating uric acid levels in mice. Furthermore, experiments involving organ culture indicated a significantly higher production of uric acid from whole adipose tissue of ob/ob than that of C57 mice. These results suggest that in mice, increased uric acid production in obese adipose tissue could contribute to the observed hyperuricemia. On the other hand, treatment with febuxostat in C57 control mice had no effect on the plasma levels of uric acid (Fig. 1A). The plasma levels of xanthine, which is a precursor of uric acid, increased in those mice (data not shown). The decrease of uric acid production in C57 mice could possibly be compensated by uric acid extraction through the urinary tract or other metabolic pathways.
In conclusion, this study provides the first evidence, using mouse models, that adipose tissue can secrete uric acid and that the production of uric acid is augmented in obesity. Recent studies have demonstrated that monosodium urate crystals act as alermin, which can initiate the immune response in the noninfectious inflammatory response (32, 54, 55). Further studies are needed to explore the relation between accelerated purine catabolism and dysfunction of adipose tissue in obesity, such as dysregulation of adipocytokines and chronic inflammation.
Acknowledgments
We express our gratitude to Yuji Matsuzawa for support of this project. We are grateful to Ikuo Mineo, Ken Kishida, and Takuya Mori for helpful discussions and technical advice. We also thank Miyuki Nakamura, Takami Hayashi, and Chieko Matsui-Watanabe for technical assistance and the Center of Medical Research and Education, Graduate School of Medicine, Osaka University for technical support. We thank all members of the Adiposcience Laboratory at the Department of Metabolic Medicine, Graduate School of Medicine, Osaka University, for helpful discussion and suggestions.
This work was supported in part by Grants-in-aid for Scientific Research (C) 24591351 (to H. N.) and 22590979 (to N. M.) and by Scientific Research on Innovative Areas Grant 22126008 (to T. F.). Tohru Funahashi is a member of the Department of Metabolism and Atherosclerosis, a sponsored course endowed by Kowa Co. Ltd. In this work, Osaka University's academia-industry collaboration policy positions the collaboration between Osaka University and Teijin Pharma Ltd.
- XOR
- xanthine oxidoreductase
- DIO
- diet-induced obesity
- Mes WAT
- mesenteric white adipose tissue
- Epi WAT
- epididymal white adipose tissue
- Sub WAT
- subcutaneous white adipose tissue
- SVC
- stromal vascular cell
- MAF
- mature adipocyte fraction
- SVF
- stromal vascular fraction
- XO
- xanthine oxidase
- XDH
- xanthine dehydrogenase.
REFERENCES
- 1. Wu X. W., Lee C. C., Muzny D. M., Caskey C. T. (1989) Urate oxidase. Primary structure and evolutionary implications. Proc. Natl. Acad. Sci. U.S.A. 86, 9412–9416 [DOI] [PMC free article] [PubMed] [Google Scholar]
- 2. Hikita M., Ohno I., Mori Y., Ichida K., Yokose T., Hosoya T. (2007) Relationship between hyperuricemia and body fat distribution. Intern. Med. 46, 1353–1358 [DOI] [PubMed] [Google Scholar]
- 3. Tamba S., Nishizawa H., Funahashi T., Okauchi Y., Ogawa T., Noguchi M., Fujita K., Ryo M., Kihara S., Iwahashi H., Yamagata K., Nakamura T., Shimomura I., Matsuzawa Y. (2008) Relationship between the serum uric acid level, visceral fat accumulation and serum adiponectin concentration in Japanese men. Intern. Med. 47, 1175–1180 [DOI] [PubMed] [Google Scholar]
- 4. Kim T. H., Lee S. S., Yoo J. H., Kim S. R., Yoo S. J., Song H. C., Kim Y. S., Choi E. J., Kim Y. K. (2012) The relationship between the regional abdominal adipose tissue distribution and the serum uric acid levels in people with type 2 diabetes mellitus. Diabetol. Metab. Syndr. 4, 3. [DOI] [PMC free article] [PubMed] [Google Scholar]
- 5. Rathmann W., Haastert B., Icks A., Giani G., Roseman J. M. (2007) Ten-year change in serum uric acid and its relation to changes in other metabolic risk factors in young black and white adults. The CARDIA study. Eur. J. Epidemiol. 22, 439–445 [DOI] [PubMed] [Google Scholar]
- 6. Coutinho Tde A., Turner S. T., Peyser P. A., Bielak L. F., Sheedy P. F., 2nd, Kullo I. J. (2007) Associations of serum uric acid with markers of inflammation, metabolic syndrome, and subclinical coronary atherosclerosis. Am. J. Hypertens. 20, 83–89 [DOI] [PubMed] [Google Scholar]
- 7. Lin S. D., Tsai D. H., Hsu S. R. (2006) Association between serum uric acid level and components of the metabolic syndrome. J. Chin. Med. Assoc. 69, 512–516 [DOI] [PubMed] [Google Scholar]
- 8. Teramoto T., Sasaki J., Ueshima H., Egusa G., Kinoshita M., Shimamoto K., Daida H., Biro S., Hirobe K., Funahashi T., Yokote K., Yokode M. (2008) Metabolic syndrome. J. Atheroscler. Thromb. 15, 1–5 [DOI] [PubMed] [Google Scholar]
- 9. Alberti K. G., Eckel R. H., Grundy S. M., Zimmet P. Z., Cleeman J. I., Donato K. A., Fruchart J. C., James W. P., Loria C. M., Smith S. C., Jr. (2009) Harmonizing the metabolic syndrome. A joint interim statement of the International Diabetes Federation Task Force on Epidemiology and Prevention; National Heart, Lung, and Blood Institute; American Heart Association; World Heart Federation; International Atherosclerosis Society; and International Association for the Study of Obesity. Circulation 120, 1640–1645 [DOI] [PubMed] [Google Scholar]
- 10. Matsuzawa Y., Funahashi T., Nakamura T. (2011) The concept of metabolic syndrome. Contribution of visceral fat accumulation and its molecular mechanism. J. Atheroscler. Thromb. 18, 629–639 [DOI] [PubMed] [Google Scholar]
- 11. Yamashita S., Matsuzawa Y., Tokunaga K., Fujioka S., Tarui S. (1986) Studies on the impaired metabolism of uric acid in obese subjects. Marked reduction of renal urate excretion and its improvement by a low-calorie diet. Int. J. Obes. 10, 255–264 [PubMed] [Google Scholar]
- 12. Matsuura F., Yamashita S., Nakamura T., Nishida M., Nozaki S., Funahashi T., Matsuzawa Y. (1998) Effect of visceral fat accumulation on uric acid metabolism in male obese subjects. Visceral fat obesity is linked more closely to overproduction of uric acid than subcutaneous fat obesity. Metabolism 47, 929–933 [DOI] [PubMed] [Google Scholar]
- 13. Cheung K. J., Tzameli I., Pissios P., Rovira I., Gavrilova O., Ohtsubo T., Chen Z., Finkel T., Flier J. S., Friedman J. M. (2007) Xanthine oxidoreductase is a regulator of adipogenesis and PPARγ activity. Cell Metab. 5, 115–128 [DOI] [PubMed] [Google Scholar]
- 14. Takano Y., Hase-Aoki K., Horiuchi H., Zhao L., Kasahara Y., Kondo S., Becker M. A. (2005) Selectivity of febuxostat, a novel non-purine inhibitor of xanthine oxidase/xanthine dehydrogenase. Life Sci. 76, 1835–1847 [DOI] [PubMed] [Google Scholar]
- 15. Sánchez-Lozada L. G., Tapia E., Bautista-García P., Soto V., Avila-Casado C., Vega-Campos I. P., Nakagawa T., Zhao L., Franco M., Johnson R. J. (2008) Effects of febuxostat on metabolic and renal alterations in rats with fructose-induced metabolic syndrome. Am. J. Physiol. Renal Physiol. 294, F710–F718 [DOI] [PubMed] [Google Scholar]
- 16. Maeda N., Shimomura I., Kishida K., Nishizawa H., Matsuda M., Nagaretani H., Furuyama N., Kondo H., Takahashi M., Arita Y., Komuro R., Ouchi N., Kihara S., Tochino Y., Okutomi K., Horie M., Takeda S., Aoyama T., Funahashi T., Matsuzawa Y. (2002) Diet-induced insulin resistance in mice lacking adiponectin/ACRP30. Nat. Med. 8, 731–737 [DOI] [PubMed] [Google Scholar]
- 17. Maeda N., Takahashi M., Funahashi T., Kihara S., Nishizawa H., Kishida K., Nagaretani H., Matsuda M., Komuro R., Ouchi N., Kuriyama H., Hotta K., Nakamura T., Shimomura I., Matsuzawa Y. (2001) PPARγ ligands increase expression and plasma concentrations of adiponectin, an adipose-derived protein. Diabetes 50, 2094–2099 [DOI] [PubMed] [Google Scholar]
- 18. Kurata A., Nishizawa H., Kihara S., Maeda N., Sonoda M., Okada T., Ohashi K., Hibuse T., Fujita K., Yasui A., Hiuge A., Kumada M., Kuriyama H., Shimomura I., Funahashi T. (2006) Blockade of angiotensin II type-1 receptor reduces oxidative stress in adipose tissue and ameliorates adipocytokine dysregulation. Kidney Int. 70, 1717–1724 [DOI] [PubMed] [Google Scholar]
- 19. Nakatani T., Tsuboyama-Kasaoka N., Takahashi M., Miura S., Ezaki O. (2002) Mechanism for peroxisome proliferator-activated receptor-α activator-induced up-regulation of UCP2 mRNA in rodent hepatocytes. J. Biol. Chem. 277, 9562–9569 [DOI] [PubMed] [Google Scholar]
- 20. Frederich R. C., Jr., Kahn B. B., Peach M. J., Flier J. S. (1992) Tissue-specific nutritional regulation of angiotensinogen in adipose tissue. Hypertension 19, 339–344 [DOI] [PubMed] [Google Scholar]
- 21. Nakagawa Y., Kishida K., Kihara S., Yoshida R., Funahashi T., Shimomura I. (2011) Nocturnal falls of adiponectin levels in sleep apnea with abdominal obesity and impact of hypoxia-induced dysregulated adiponectin production in obese murine mesenteric adipose tissue. J. Atheroscler. Thromb. 18, 240–247 [DOI] [PubMed] [Google Scholar]
- 22. Aoki T., Yoshiura M., Iwamoto T., Iriyama K. (1984) Postmortem changes of uric acid in various rat tissues. Determination of uric acid by reversed-phase high-performance liquid chromatography with electrochemical detection. Anal. Biochem. 143, 113–118 [DOI] [PubMed] [Google Scholar]
- 23. Sekimoto R., Kishida K., Nakatsuji H., Nakagawa T., Funahashi T., Shimomura I. (2012) High circulating levels of S100A8/A9 complex (calprotectin) in male Japanese with abdominal adiposity and dysregulated expression of S100A8 and S100A9 in adipose tissues of obese mice. Biochem. Biophys. Res. Commun. 419, 782–789 [DOI] [PubMed] [Google Scholar]
- 24. Beckman J. S., Parks D. A., Pearson J. D., Marshall P. A., Freeman B. A. (1989) A sensitive fluorometric assay for measuring xanthine dehydrogenase and oxidase in tissues. Free Radic. Biol. Med. 6, 607–615 [DOI] [PubMed] [Google Scholar]
- 25. Kayyali U. S., Donaldson C., Huang H., Abdelnour R., Hassoun P. M. (2001) Phosphorylation of xanthine dehydrogenase/oxidase in hypoxia. J. Biol. Chem. 276, 14359–14365 [DOI] [PubMed] [Google Scholar]
- 26. Tsuda H., Kawada N., Kaimori J. Y., Kitamura H., Moriyama T., Rakugi H., Takahara S., Isaka Y. (2012) Febuxostat suppressed renal ischemia-reperfusion injury via reduced oxidative stress. Biochem. Biophys. Res. Commun. 427, 266–272 [DOI] [PubMed] [Google Scholar]
- 27. Kishida K., Kuriyama H., Funahashi T., Shimomura I., Kihara S., Ouchi N., Nishida M., Nishizawa H., Matsuda M., Takahashi M., Hotta K., Nakamura T., Yamashita S., Tochino Y., Matsuzawa Y. (2000) Aquaporin adipose, a putative glycerol channel in adipocytes. J. Biol. Chem. 275, 20896–20902 [DOI] [PubMed] [Google Scholar]
- 28. Evrard P. A., Deridder G., Verbeeck R. K. (1996) Intravenous microdialysis in the mouse and the rat. Development and pharmacokinetic application of a new probe. Pharm. Res. 13, 12–17 [DOI] [PubMed] [Google Scholar]
- 29. García-Ruiz I., Rodríguez-Juan C., Díaz-Sanjuan T., del Hoyo P., Colina F., Muñoz-Yagüe T., Solís-Herruzo J. A. (2006) Uric acid and anti-TNF antibody improve mitochondrial dysfunction in ob/ob mice. Hepatology 44, 581–591 [DOI] [PubMed] [Google Scholar]
- 30. Nishino T., Okamoto K., Eger B. T., Pai E. F., Nishino T. (2008) Mammalian xanthine oxidoreductase. Mechanism of transition from xanthine dehydrogenase to xanthine oxidase. FEBS J. 275, 3278–3289 [DOI] [PubMed] [Google Scholar]
- 31. Kurosaki M., Li, Calzi M., Scanziani E., Garattini E., Terao M. (1995) Tissue- and cell-specific expression of mouse xanthine oxidoreductase gene in vivo. Regulation by bacterial lipopolysaccharide. Biochem. J. 306, 225–234 [DOI] [PMC free article] [PubMed] [Google Scholar]
- 32. Kono H., Chen C. J., Ontiveros F., Rock K. L. (2010) Uric acid promotes an acute inflammatory response to sterile cell death in mice. J. Clin. Invest. 120, 1939–1949 [DOI] [PMC free article] [PubMed] [Google Scholar]
- 33. Kamiike W., Watanabe F., Hashimoto T., Tagawa K., Ikeda Y., Nakao K., Kawashima Y. (1982) Changes in cellular levels of ATP and its catabolites in ischemic rat liver. J Biochem. 91, 1349–1356 [DOI] [PubMed] [Google Scholar]
- 34. Van Bilsen M., van der Vusse G. J., Coumans W. A., de Groot M. J., Willemsen P. H., Reneman R. S. (1989) Degradation of adenine nucleotides in ischemic and reperfused rat heart. Am. J. Physiol. 257, H47–H54 [DOI] [PubMed] [Google Scholar]
- 35. Idström J. P., Soussi B., Elander A., Bylund-Fellenius A. C. (1990) Purine metabolism after in vivo ischemia and reperfusion in rat skeletal muscle. Am. J. Physiol. 258, H1668–H1673 [DOI] [PubMed] [Google Scholar]
- 36. Zager R. A. (1991) Adenine nucleotide changes in kidney, liver, and small intestine during different forms of ischemic injury. Circ. Res. 68, 185–196 [DOI] [PubMed] [Google Scholar]
- 37. Lazzarino G., Vagnozzi R., Tavazzi B., Pastore F. S., Di Pierro D., Siragusa P., Belli A., Giuffré R., Giardina B. (1992) MDA, oxypurines, and nucleosides relate to reperfusion in short-term incomplete cerebral ischemia in the rat. Free Radic. Biol. Med. 13, 489–498 [DOI] [PubMed] [Google Scholar]
- 38. De Leyn P., Lerut T., Schreinemakers H., van Belle H., Lauwerijns J., van Lommel F., Verbeken E., Flameng W. (1993) Adenine nucleotide degradation in ischemic rabbit lung tissue. Am. J. Physiol. 264, L329–337 [DOI] [PubMed] [Google Scholar]
- 39. Hosogai N., Fukuhara A., Oshima K., Miyata Y., Tanaka S., Segawa K., Furukawa S., Tochino Y., Komuro R., Matsuda M., Shimomura I. (2007) Adipose tissue hypoxia in obesity and its impact on adipocytokine dysregulation. Diabetes 56, 901–911 [DOI] [PubMed] [Google Scholar]
- 40. Ye J., Gao Z., Yin J., He Q. (2007) Hypoxia is a potential risk factor for chronic inflammation and adiponectin reduction in adipose tissue of ob/ob and dietary obese mice. Am. J. Physiol. Endocrinol. Metab. 293, E1118–E1128 [DOI] [PubMed] [Google Scholar]
- 41. Goossens G. H., Blaak E. E. (2012) Adipose tissue oxygen tension. Implications for chronic metabolic and inflammatory diseases. Curr. Opin. Clin. Nutr. Metab. Care. 15, 539–546 [DOI] [PubMed] [Google Scholar]
- 42. Terada L. S., Guidot D. M., Leff J. A., Willingham I. R., Hanley M. E., Piermattei D., Repine J. E. (1992) Hypoxia injures endothelial cells by increasing endogenous xanthine oxidase activity. Proc. Natl. Acad. Sci. U.S.A. 89, 3362–3366 [DOI] [PMC free article] [PubMed] [Google Scholar]
- 43. Kelley E. E., Hock T., Khoo N. K., Richardson G. R., Johnson K. K., Powell P. C., Giles G. I., Agarwal A., Lancaster J. R., Jr., Tarpey M. M. (2006) Moderate hypoxia induces xanthine oxidoreductase activity in arterial endothelial cells. Free Radic. Biol. Med. 40, 952–959 [DOI] [PubMed] [Google Scholar]
- 44. Wang G., Qian P., Jackson F. R., Qian G., Wu G. (2008) Sequential activation of JAKs, STATs and xanthine dehydrogenase/oxidase by hypoxia in lung microvascular endothelial cells. Int. J. Biochem. Cell Biol. 40, 461–470 [DOI] [PMC free article] [PubMed] [Google Scholar]
- 45. Sun K., Kusminski C. M., Scherer P. E. (2011) Adipose tissue remodeling and obesity. J. Clin. Invest. 121, 2094–2101 [DOI] [PMC free article] [PubMed] [Google Scholar]
- 46. Spiegelman B. M., Flier J. S. (1996) Adipogenesis and obesity. Rounding out the big picture. Cell 87, 377–389 [DOI] [PubMed] [Google Scholar]
- 47. Leyva F., Wingrove C. S., Godsland I. F., Stevenson J. C. (1998) The glycolytic pathway to coronary heart disease. A hypothesis. Metabolism 47, 657–662 [DOI] [PubMed] [Google Scholar]
- 48. Vorbach C., Scriven A., Capecchi M. R. (2002) The housekeeping gene xanthine oxidoreductase is necessary for milk fat droplet enveloping and secretion. Gene sharing in the lactating mammary gland. Genes Dev. 16, 3223–3235 [DOI] [PMC free article] [PubMed] [Google Scholar]
- 49. Ohtsubo T., Matsumura K., Sakagami K., Fujii K., Tsuruya K., Noguchi H., Rovira I. I., Finkel T., Iida M. (2009) Xanthine oxidoreductase depletion induces renal interstitial fibrosis through aberrant lipid and purine accumulation in renal tubules. Hypertension 54, 868–876 [DOI] [PMC free article] [PubMed] [Google Scholar]
- 50. Kather H., Rivera M., Brand K. (1972) Interrelationship and control of glucose metabolism and lipogenesis in isolated fat-cells. Effect of the amount of glucose uptake on the rates of the pentose phosphate cycle and of fatty acid synthesis. Biochem. J. 128, 1089–1096 [DOI] [PMC free article] [PubMed] [Google Scholar]
- 51. Park J., Rho H. K., Kim K. H., Choe S. S., Lee Y. S., Kim J. B. (2005) Overexpression of glucose-6-phosphate dehydrogenase is associated with lipid dysregulation and insulin resistance in obesity. Mol. Cell. Biol. 25, 5146–5157 [DOI] [PMC free article] [PubMed] [Google Scholar]
- 52. Greenberg A. S., Coleman R. A., Kraemer F. B., McManaman J. L., Obin M. S., Puri V., Yan Q. W., Miyoshi H., Mashek D. G. (2011) The role of lipid droplets in metabolic disease in rodents and humans. J. Clin. Invest. 121, 2102–2110 [DOI] [PMC free article] [PubMed] [Google Scholar]
- 53. Kather H. (1990) β-Adrenergic stimulation of adenine nucleotide catabolism and purine release in human adipocytes. J. Clin. Invest. 85, 106–114 [DOI] [PMC free article] [PubMed] [Google Scholar]
- 54. Martinon F., Pétrilli V., Mayor A., Tardivel A., Tschopp J. (2006) Gout-associated uric acid crystals activate the NALP3 inflammasome. Nature 440, 237–241 [DOI] [PubMed] [Google Scholar]
- 55. Foell D., Wittkowski H., Roth J. (2007) Mechanisms of disease. A “DAMP” view of inflammatory arthritis. Nat. Clin. Pract. Rheumatol. 3, 382–390 [DOI] [PubMed] [Google Scholar]