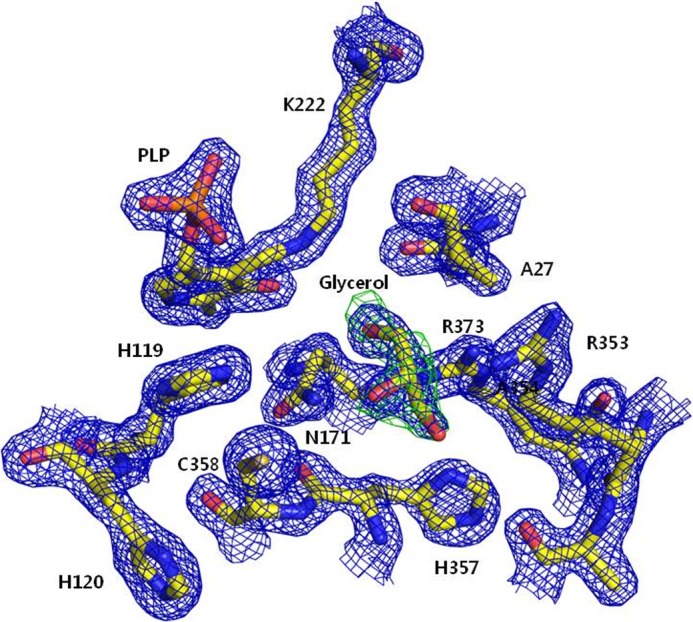
FIGURE 3.

Electron densities near the active Cys-358 of CsdA. The view of Cys-358 active site in one representative CsdA subunit is shown in ball-and-stick representation with electron density maps. 2Fo − Fc density in blue is contoured at 1.5σ, and Fo − Fc density of the glycerol OMIT map is contoured at 4σ. PLP and glycerol are observed in all the three CsdA subunits.
