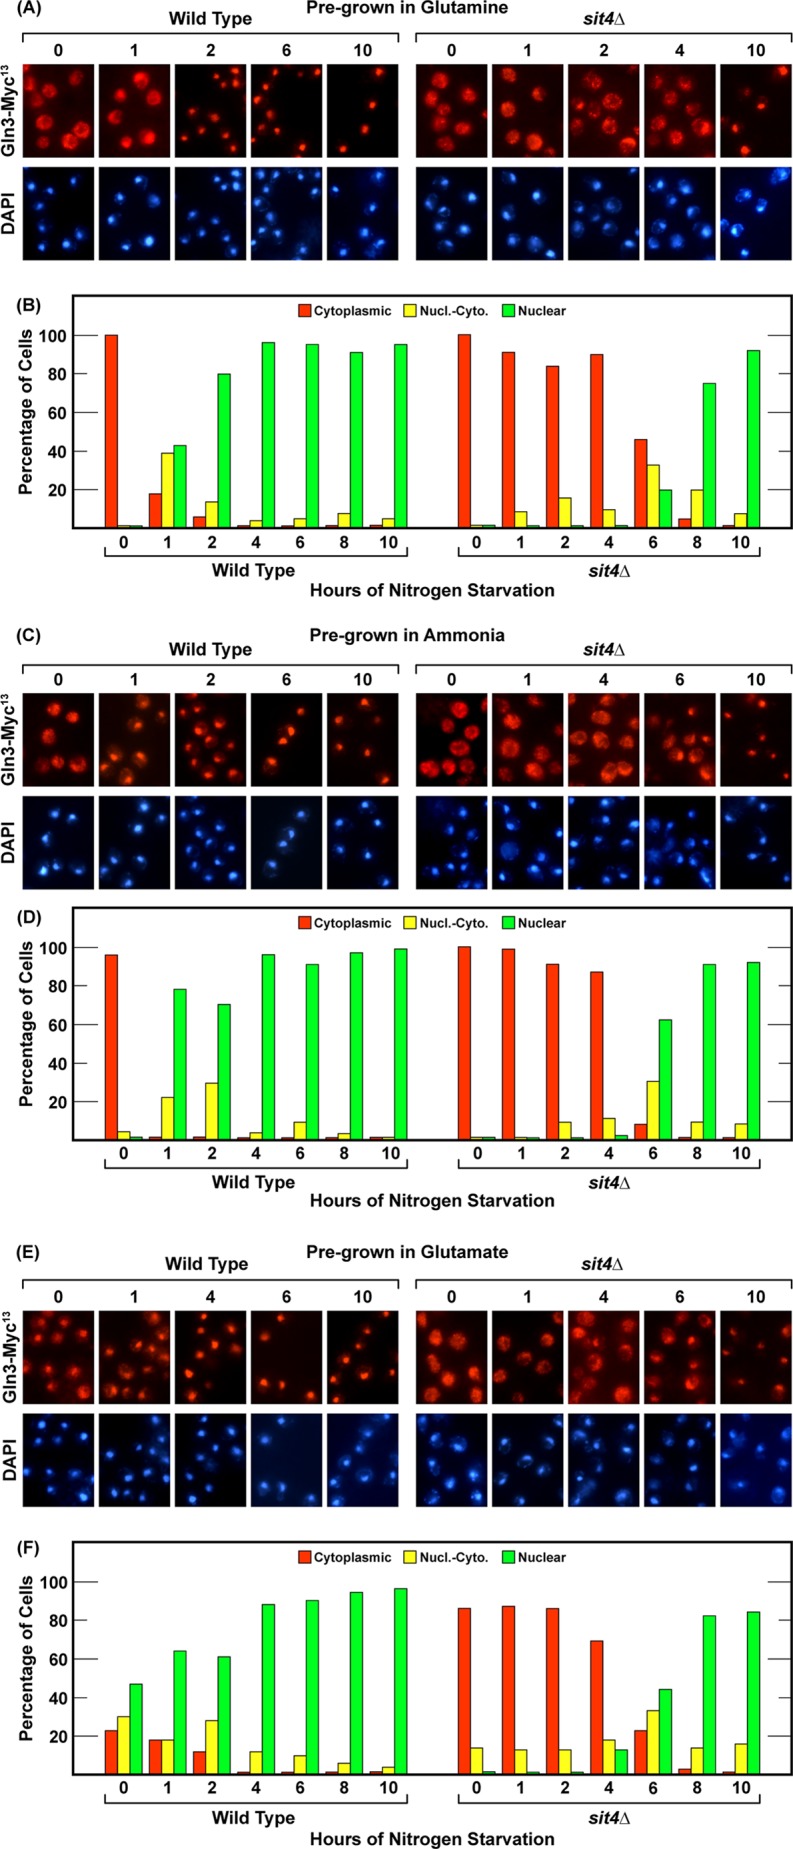
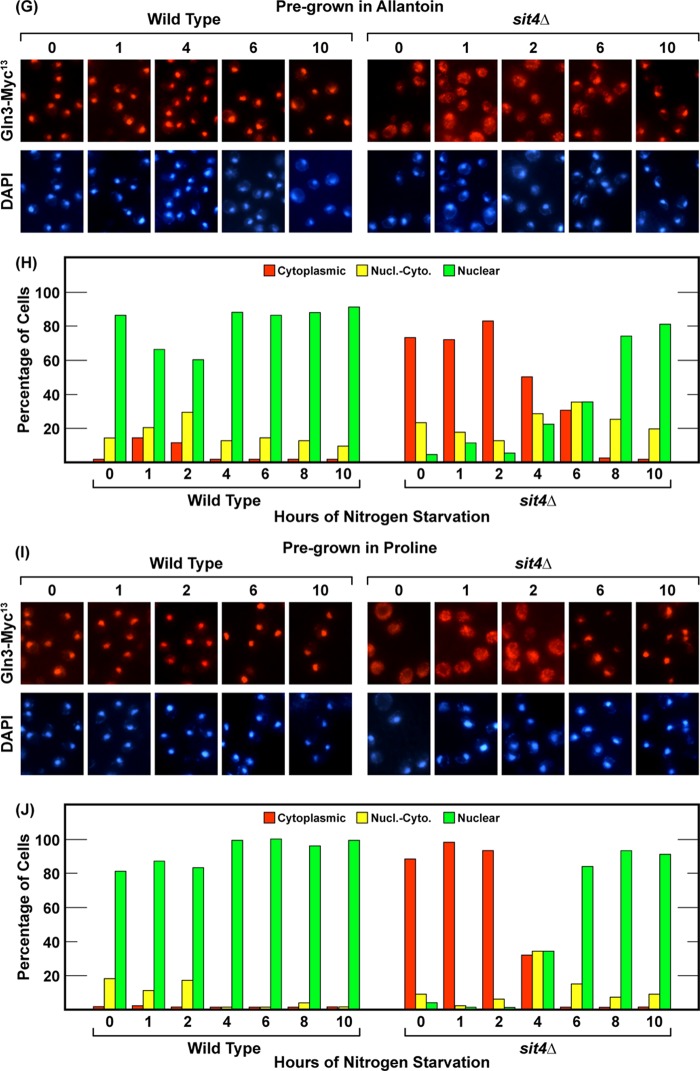
FIGURE 1.

Nuclear Gln3-Myc13 localization in response to nitrogen limitation and nitrogen starvation exhibit different Sit4 phosphatase requirements. Wild-type (TB123) and sit4Δ (TB136-2a) strains were grown to mid-log phase (A600 nm = 0.5) in YNB medium (without amino acids or ammonium sulfate) containing the nitrogen source indicated at the top. After sampling, the cultures were transferred to nitrogen-free medium, and sampling continued for 10 h. Samples were prepared for microscopic examination as described under “Materials and Methods.” A, C, E, G, and I, representative images from which the corresponding histograms in B, D, F, H, and J were generated. Red bars indicate Gln3-Myc13 indirect immunofluorescence in the cytoplasm only, yellow bars indicate both cytoplasmic and nuclear fluorescence (Nucl.-Cyto.), and green bars indicate fluorescence in the nucleus only. The precision of scoring has been repeatedly characterized in detail (34, 36, 37, 39). The average error in 10 experiments performed over 9 months ranged from ± 7–8% (39). Note that representative microscopic images similar to those presented here (e.g. A) and all figures were prepared for every time point assayed. However, the particular images presented in the figure of wild-type cells do not always correspond to those in the mutant cells or conditions (note the time differences). Space limitations restricted the total number of images we could present. Therefore, we chose the images that were most evaluative for the arguments presented. Histograms depict all of the data collected. For example, in A, it is most important that Gln3-Myc13 was almost completely nuclear in wild-type cells after 2 h of starvation, whereas in the sit4Δ cultures it remained completely cytoplasmic at 4 h.

