FIGURE 6.
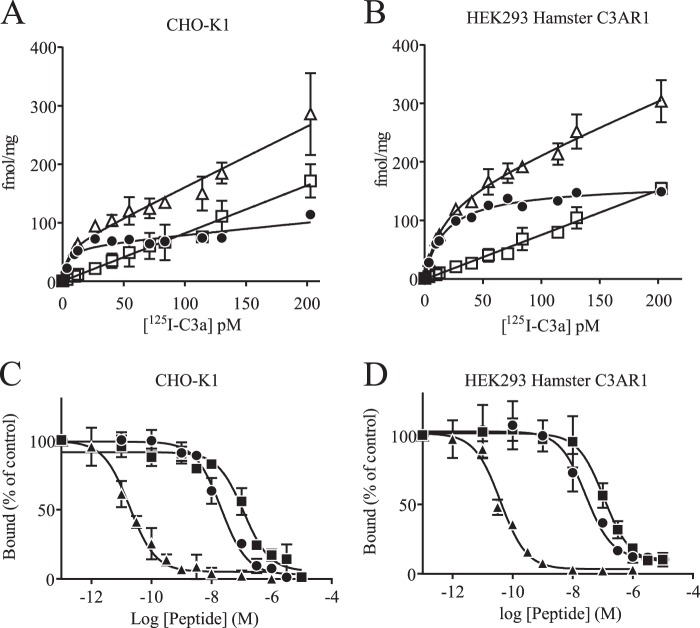
TLQP-21 binding studies. A, saturation plot of human 125I-labeled C3a using CHO-K1 membranes. ▵, total; □, nonspecific; ●, specific. B, saturation plot of human 125I-labeled C3a using membranes of HEK293 cells expressing hamster C3AR1. ▵, total; □, nonspecific; ●, specific. C, inhibition-binding isotherms of 125I-labeled C3a in CHO-K1 membrane preparations. D, inhibition-binding isotherms of 125I-labeled C3a in hamster C3AR1-expressing HEK293 membrane preparations. ▴, human C3a; ●, rat TLQP-21; ■, human TLQP-21. Data are represented as means ± S.D.

