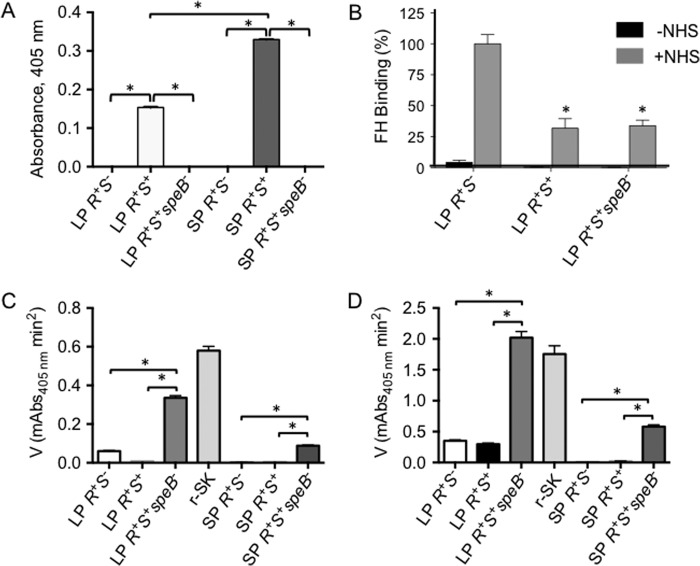
FIGURE 4.
Influence of speB expression on functional PAM display on AP53 cells and isogenic mutants. A, mSpeB assays in AP53 cell supernatants demonstrate that mSpeB is less strongly produced in LP (A600 nm ∼ 0.6) cultures than in the cultures at early SP (A600 nm ∼ 1.0). *, p < 0.05 for the comparisons indicated. n = 4. B, quantitation of Western blot bands of the binding of FH to various LP AP53 cell lines in the absence (−) and presence (+) of NHS where the percentage of relative binding of FH to AP53/covR+S+ (R+S+) and AP53/covR+S+speB− (R+S+speB−) is based on FH binding to AP53/covR+S− (R+S−) cells arbitrarily set to 100%. *, p < 0.05 when comparing the indicated strains with covR+S−. n = 4. C and D, activation of hPg by SK present in conditioned culture supernatants of various isogenic GAS cell lines in the absence of PAM (C) and in the presence of 1 μm PAM (D). Initial rates of activation are shown for each cell supernatant at LP and early SP growth of cells. r-SK (5 nm) is shown as a standard. *, p < 0.05 for the comparisons indicated. n = 4 for supernatants of each strain. Error bars represent S.E. mAbs, milliabsorbance units.

