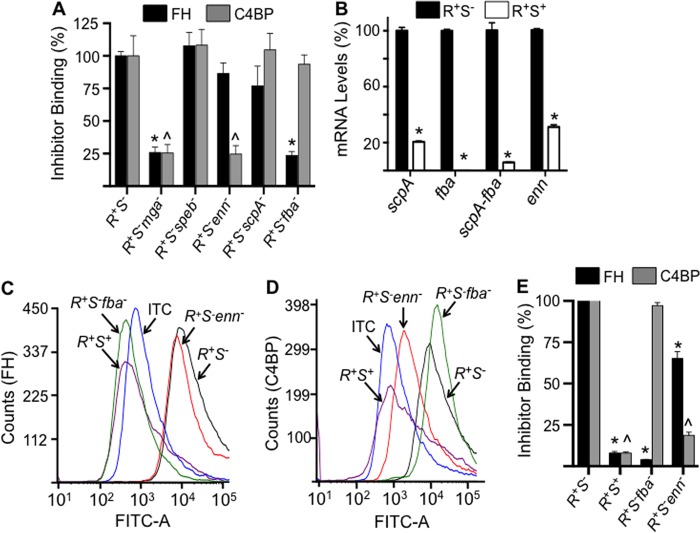
FIGURE 5.
A, binding of FH and C4BP to AP53 cells and isogenic mutants. Western blot gels were quantitated as in Fig. 2 to provide the binding data of FH and C4BP to individual proximal genes of the mga regulon. These data for pam− cells have been provided in Fig. 2. The percentage of relative binding for each inhibitor was calculated from Western blot band intensities relative to the binding of that inhibitor to covR+S−. *, p < 0.05 comparing the binding of the individual strains with covR+S−. B, relative expression of AP53 genes of the mga regulon, viz. scpA, fba, bicistronic scpA-fba, and enn, in the isolated total RNA from covR+S− (R+S−) and covR+S+ (R+S+) cells. The reference gene was gapdh. C and D, typical FCA histograms of the binding of FH (C) and C4BP (D) to isogenic cell lines. Cells of each of the indicated lines (∼2 × 10⁸ cfu) were incubated at 37 °C with FH (10 μg/ml) (C) or C4BP (10 μg/ml) (D). Mouse anti-human FH or mouse anti-human C4BP was then added followed by Alexa Fluor 488-donkey anti-mouse IgG. Acquisition and analysis of the histograms were performed as in Fig. 3. E, the percentage of binding of FH and C4BP was calculated from histograms of C and D obtained from multiple runs (n = 4 for each cell line). The FH or C4BP binding to AP53/covR+S− was arbitrarily taken as 100%, and the relative binding of these inhibitors, each normalized to 100% binding to AP53/covR+S−, to other strains was calculated using the median fluorescence intensity statistical value provided from analysis of each FCA histogram by FCS Express version 4 software. ITC refers to the isotype antibody control. *, p < 0.05 in comparisons of FH binding of the indicated strains with AP53/covR+S−. ∧, p < 0.05 in comparisons of C4BP binding of the indicated strains with AP53/covR+S−. n = 4 for each strain. Error bars represent S.E.

