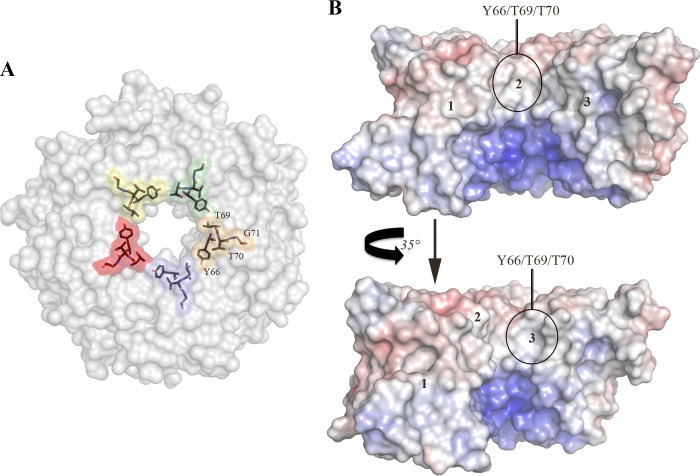
FIGURE 4.
A, The molecular surfaces of residues Tyr-66, Thr-69, Thr-70, and Gly-71 are colored by protomer, and the positions of those residues are also shown as sticks. B, calculated molecular electrostatic surface potential of three SubB protomers shown in two orientations. The Tyr-66, Thr-69, Thr-70, and Gly-71 surface locations are indicated. Negative surfaces are in red (−10 kT), neutral surfaces are in white (0 kiloteslas), and positive surfaces are in blue (10 kiloteslas). The surface electrostatic potential map was calculated using the nonlinear mode of the Adaptive Poisson Boltzmann Solver (APBS) (30, 31). The figures were generated using PyMOL (29).

