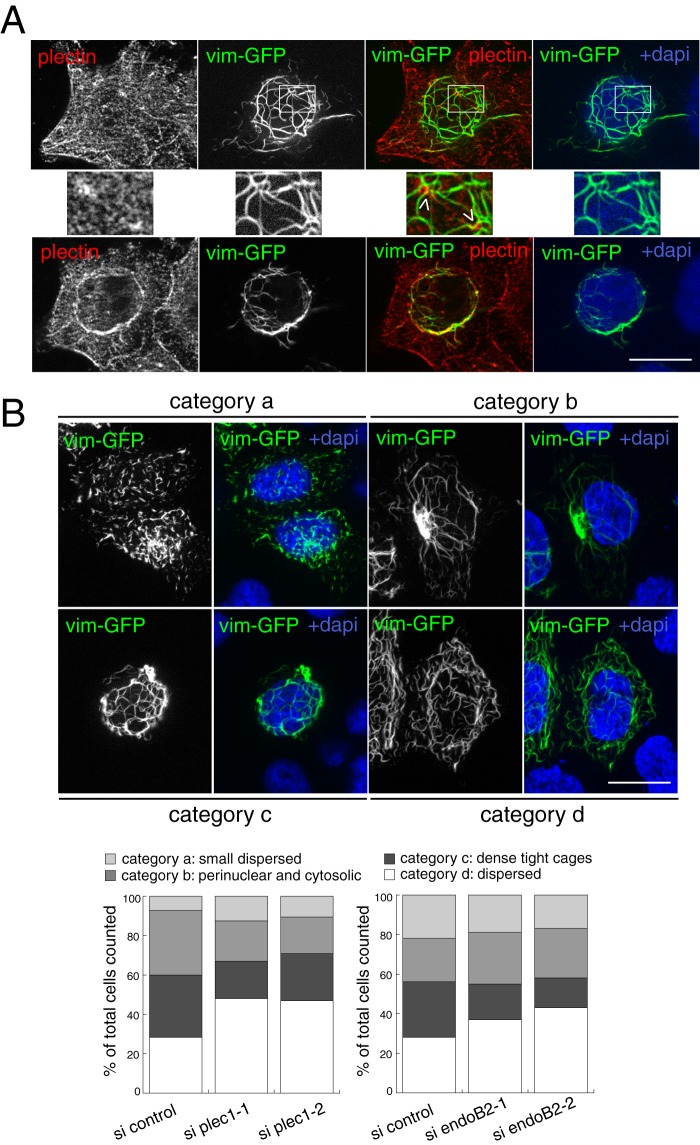
FIGURE 10.
Establishment of a tight perinuclear vimentin network requires plec1 and endoB2. A, HeLa/endoB2-St cells were transfected to express vim-GFP (10 h of expression). Cells were processed for immunofluorescence using anti-plectin antibodies. Images show two z-sections of the same cell, with top images obtained at a plane between the nucleus and the membrane contacting the coverslip and the bottom images obtained at a plane partly crossing the nucleus. Middle panels correspond to magnification of the areas delimited in the top panels and show plectin-enriched spots in contact with vimentin filaments (arrowheads). B, HeLa/endoB2-St cells were transfected with control, plec1 (si plec1-1 and si plec1-2) or endoB2 (si endoB2-1 and si endoB2-2) siRNAs for 72 h. They were subsequently transfected to express vim-GFP for 10 h. Top panels are z-sections showing four main different vim-GFP organization patterns exhibited by cells and defining categories, respectively, characterized as follows: category a, dispersion of small vimentin filamentous units; category b, localization of the vimentin network both in the perinuclear region and across the cytoplasm, with a concentrated spot nearby the nucleus; category c, organization of vimentin filaments as dense, tight cages around the nucleus; category d, dispersion of the meshwork across the entire cellular volume. Images of categories –c were obtained from cells treated with control siRNAs and of category d from cells treated with plec1-1 siRNAs (similar extensive dispersion of the network was also obtained for plec1-2 and endoB2-1 and endoB2-2 siRNAs). Bottom panels were obtained from numeration of cells belonging to each category, for both plec1 and endoB2 siRNAs. In the bottom left panel, n = 449, 476, and 221 counted cells for si control, si plec1-1, and si plec1-2, respectively. In the bottom right panel, n = 423, 451, and 435 counted cells for si control, si endoB2-1, and si endoB2-2, respectively. Similar results were obtained in independent experiments performed with regular HeLa cells in which the most significant effect was the major decrease in the proportion of cells characterized by the presence of tight vimentin cages (category c) for both plec1 and endoB2 siRNAs treatments and in comparison with the respective controls (12.8 and 15.1% of cells belonging to category c for si plec1-1 (n = 251 cells) and si plec1-2 (n = 239 cells), respectively, in comparison with 39.4% for the control (n = 323 cells); 9.7 and 10.1% of cells belonging to category c for si endoB2-1 (n = 277 cells) and si endoB2-2 (n = 289 cells), respectively, in comparison with 30.2% for the control (n = 215 cells)). Scale bars, 20 μm.

