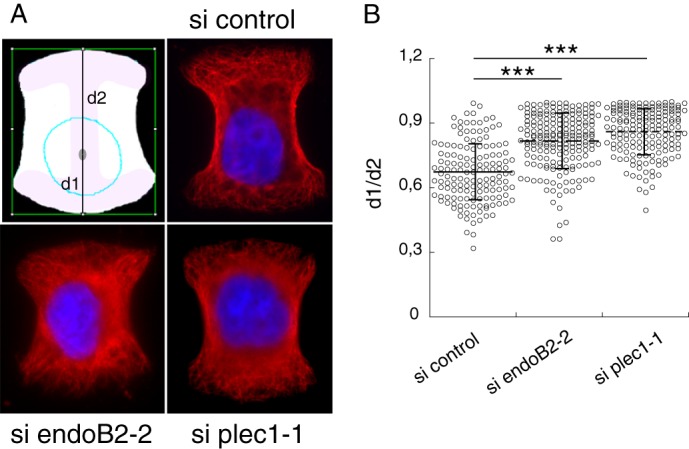
FIGURE 11.

EndoB2 and plec1 control nuclear positioning. HeLa cells were transfected with control, plec1-1, or endoB2-2 siRNAs for 72 h, plated on micropatterns, and processed for tubulin immunostaining and DAPI staining. A, z-sections of cells from indicated siRNA treatments, immobilized on medium patterns, and showing the respective positions of nuclei. The schematic drawing shows distances d1 and d2 measured along the y axis of the pattern for scoring nuclei positioning (see “Experimental Procedures”). B, quantification and statistical analysis of nuclear positioning. n = 146, 163, and 192 cells analyzed for control, plec1-1, and endoB2-2 siRNAs, respectively, and pooled from two independent experiments. Horizontal lines and vertical bars indicate means ± S.D. p values are from Student's t test. *** indicates p values < 0.0001.
