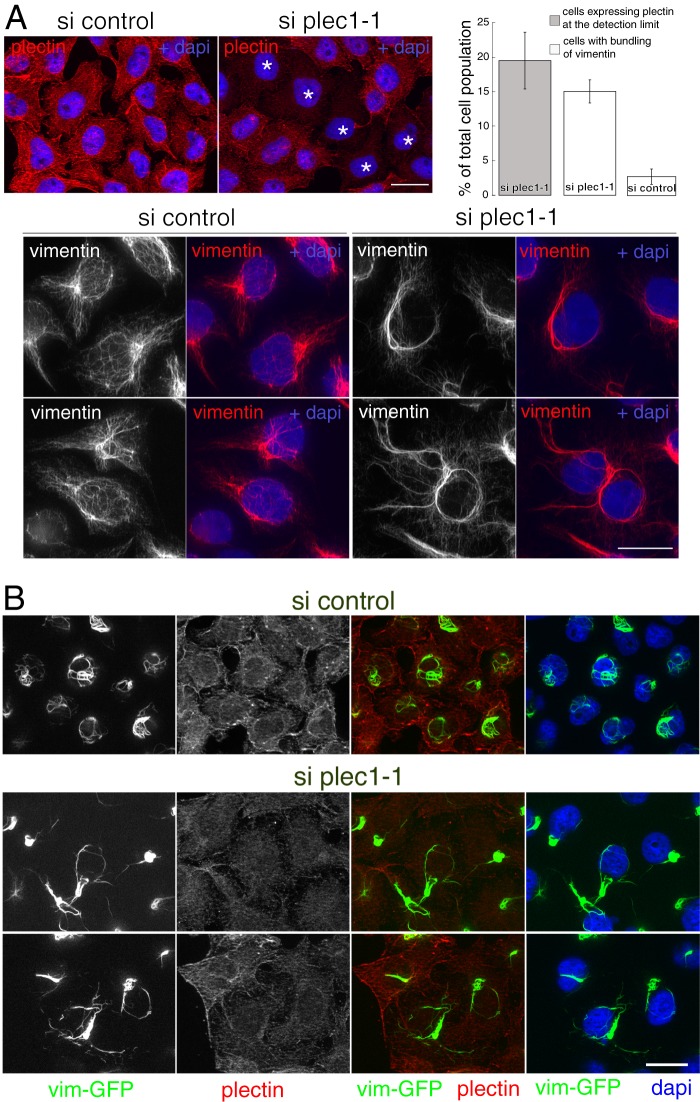
FIGURE 8.
Decrease of plec1 expression by siRNA interference and incidence on the vimentin network. HeLa/endoB2-St cells were transfected with control or plec1-1 siRNAs for 72 h, as indicated. A, top left panel, z-sections obtained from cells processed for plectin immunostaining to attest for the presence of cells with significant decrease in plec1 expression (top left (si plec1-1), note the presence of cells that express plectin at a level approaching the detection limit (*)). Top right panel, quantification of cells treated with si plec1-1 that express plectin at the detection limit and exhibit bundling of vimentin filaments (n = 646 and 780 cells analyzed, respectively) and of cells treated with si control that exhibit bundling of vimentin filaments (n = 430 cells analyzed). Values are means ± S.D. calculated from three independent experiments. Bottom panel, images are from z-projections of five z-sections, each separated by a distance of 0.260 μm and obtained from cells processed for immunofluorescence using anti-vimentin antibodies. Note the perinuclear bundling of IF and the decrease in the density of vimentin filaments encaging nuclei clearly visible in cells treated with control siRNAs. Similar results were obtained with si plec1-2 siRNAs. Scale bars, 20 μm. B, z-sections obtained from HeLa cells stably expressing vim-GFP, treated with control or plec1-1 siRNAs as indicated, and processed for immunofluorescence using anti-plectin antibodies. Images were taken with the same optical settings. Note that cells treated with plec1-1 siRNAs and expressing plectin at low level are characterized by the bundling of vimentin filaments in the close vicinity of nuclei and across the cytoplasm. Results were similar with si plec1-2 siRNAs. Scale bar, 20 μm.

