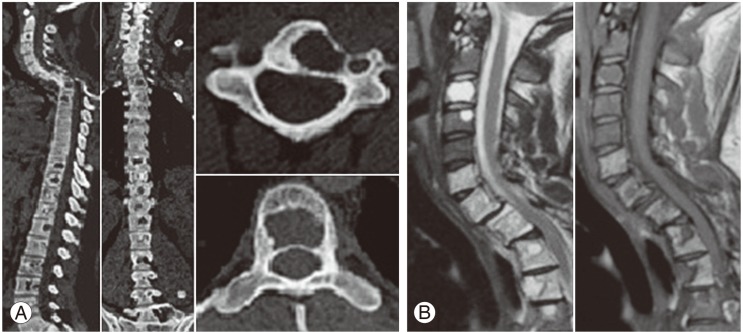
Fig. 5.
(A) Computed tomography scan images showing multiple lytic lesions within the body involving multiple vertebrae and kyphotic deformity at D1 and D2. (B) Magnetic resonance images of spine showing hypersignal intensity on T1 and mixed signal intensity on T2 weighted images within the body of the vertebra.

