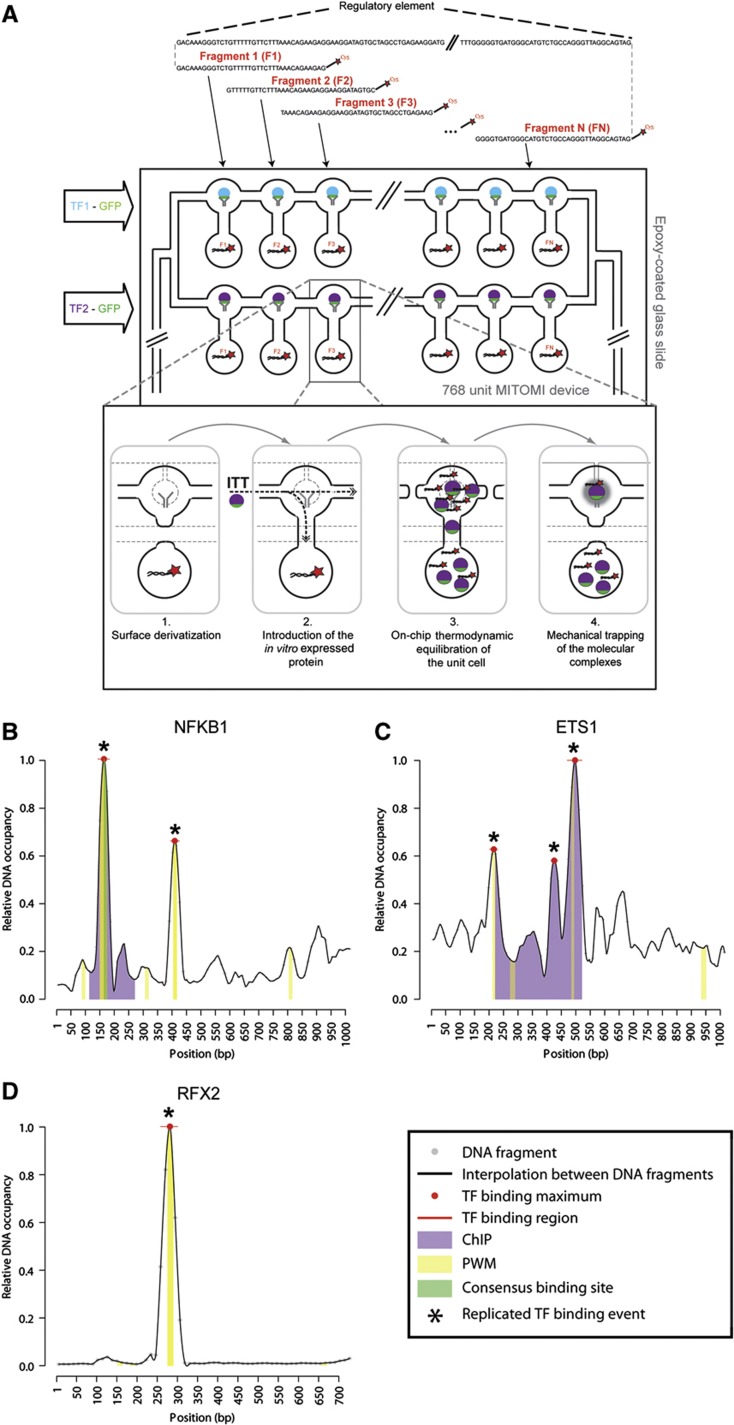
Figure 4.
MARE pipeline and results. (A) Schematic picture of the MARE principle. Cy5-labeled, double-stranded DNA fragments derived from the regulatory element of interest are spotted on an epoxy glass slide. The glass slide is then aligned with a MITOMI chip such that each microfluidic unit cell contains only one fragment of the regulatory element. The expression templates coding for TFs were incubated off-chip with an ITT mix after which the resulting proteins were introduced in different rows of the MITOMI chip using a multiplexer design. The dynamic protein–DNA interaction detection steps are described in the inlet. (1) The surface chemistry is derivatized as described in Maerkl and Quake (2009) allowing the immobilization of biotinylated-GFP antibody at the center of the upper unit. (2) The in vitro translated protein is introduced into the units. (3) The microfluidic chip is then incubated for 1 h to allow the thermodynamic equilibration of putative TF–DNA interactions. (4) TF–DNA interactions are pulled down in the center region of the upper unit by the biotinylated GFP-antibody and then mechanically trapped by closing a microfluidically controlled ‘button’ membrane, which removes all surrounding solution phase molecules after washing. The TF (GFP) and DNA element (Cy5) fluorescence is then quantified with a microarray-like fluorescent scanner, enabling the assessment of how much TF and DNA element is trapped. Note that here, only one protein binding to one DNA fragment is visualized. This is a simplification as in reality many TFs are pulled down in each unit, and all of them are able to bind to the respective DNA fragments. (B–D) Examples of MARE-based protein–DNA interaction analyses with individual fragments derived from the Mmp9 promoter element involving NFKB1 (B) and ETS1 (C) or with fragments derived from the Mcts2-Id1 enhancer element involving RFX2 (D). Data for the other tested interactions are shown in Supplementary Figures S13 and S16. Bound DNA levels normalized over surface-immobilized protein amounts are plotted for each 12 bp nucleotide stretch as small gray dots with horizontal lines indicating the 12 bp region. Signals between every 12 bp nucleotide were determined by interpolation. Significant sequence-specific binding region peaks are pointed out with a red line, while binding region maxima are highlighted with red dots. Peaks found in two independent experiments are marked by an asterisk. When applicable, a ChIP-based region (ETS1 and ETS2; Wei et al, 2009) and position weight matrix (PWM)-based binding site predictions are indicated with purple and yellow bars, respectively. The consensus NFKB1 binding region is indicated by a green bar.

