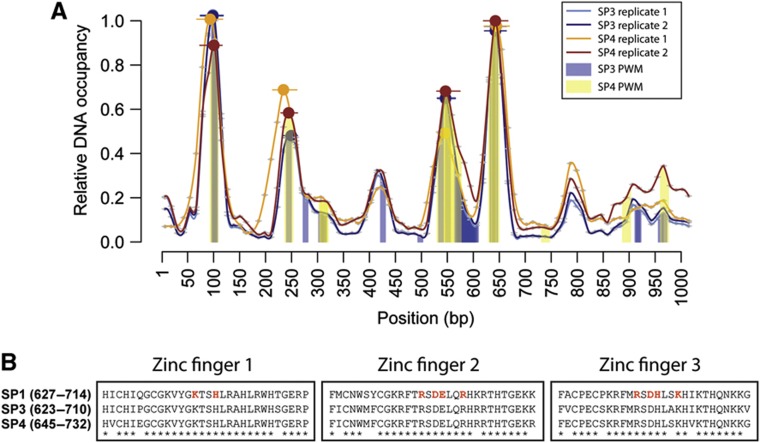
Figure 5.
Shared DNA occupancy landscape between SP3 and SP4 across the Mmp9 promoter element. (A) MARE-based analysis of Y1H-detected protein–DNA interactions involving the TFs SP3 and SP4 and the Mmp9 promoter. For each replicate, the relative DNA occupancy values are plotted as described in Figure 4. SP3 replicate 1, SP3 replicate 2, SP4 replicate 1, and SP4 replicate 2 are represented by light blue, dark blue, orange, and brown lines, respectively. The PWM-based binding site predictions for SP3 and SP4 proteins are indicated with blue and yellow bars. (B) Multiple protein alignment of the annotated SP1 DNA binding domain with SP3 and SP4. Star symbols indicate identical amino acids across all three proteins. Amino acids highlighted in red indicate the proposed protein–DNA interaction residues of the human SP1 protein (Oka et al, 2004). The SP1 DNA binding domain between human and mouse is highly conserved with only a single amino-acid change between both proteins.

