Figure 6.
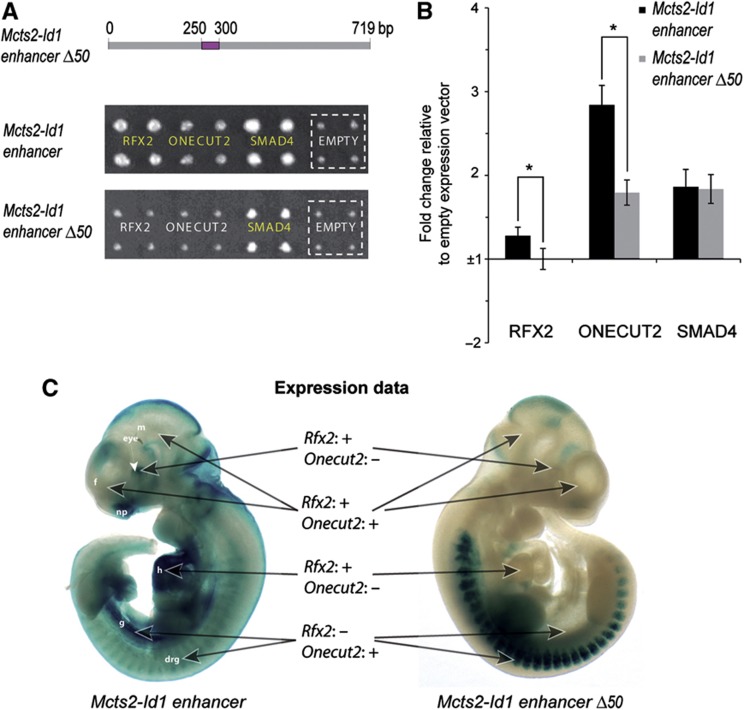
RFX2 and ONECUT2 regulate the activity of the Mcts2-Id1 enhancer through a 50bp region. (A). Manual transformation experiments of RFX2 and ONECUT2 with either the wild type or the 50 bp deletion (Δ50, highlighted in purple) Mcts2-Id1 enhancer element. Yeast strains were spotted in quadruplet. Positive interactions are highlighted in yellow and can be compared with a negative control (original pAD-DEST vector, termed ‘empty’ and indicated by a dashed square) illustrating the background growth for each DNA bait. The baits were selected on 10 mM 3-AT. (B) Luciferase reporter-based validation with either the wild type or the Δ50 enhancer element. HEK293 cells were transiently co-transfected with DNA bait reporter construct, each of the respective TFs, and the Renilla luciferase vector. The fold change of the normalized firefly to Renilla ratio compared with the normalized firefly to Renilla ratio of the negative control (empty expression vector) is plotted. The error bars represent the standard error of 10 independent biological experiments. 0.01<*P<0.05 compared with the wild-type construct. (C) LacZ staining results of E10.5 transgenic embryos containing either the wild type (left) or the Δ50 (right) Mcts2-Id1 enhancer-lacZ reporter construct. The expression profiles of RFX2 and ONECUT2 in the highlighted organs as derived from the literature are summarized by ‘+’ (expression) or ‘−’ (no evidence of expression). These two embryos contained two integrated lentiviral DNA copies each. f, forebrain; m, midbrain; np, nasal placode; h, heart; g, future midgut; drg, dorsal root ganglion. Source data for this figure is available on the online supplementary information page.

