Figure 1.
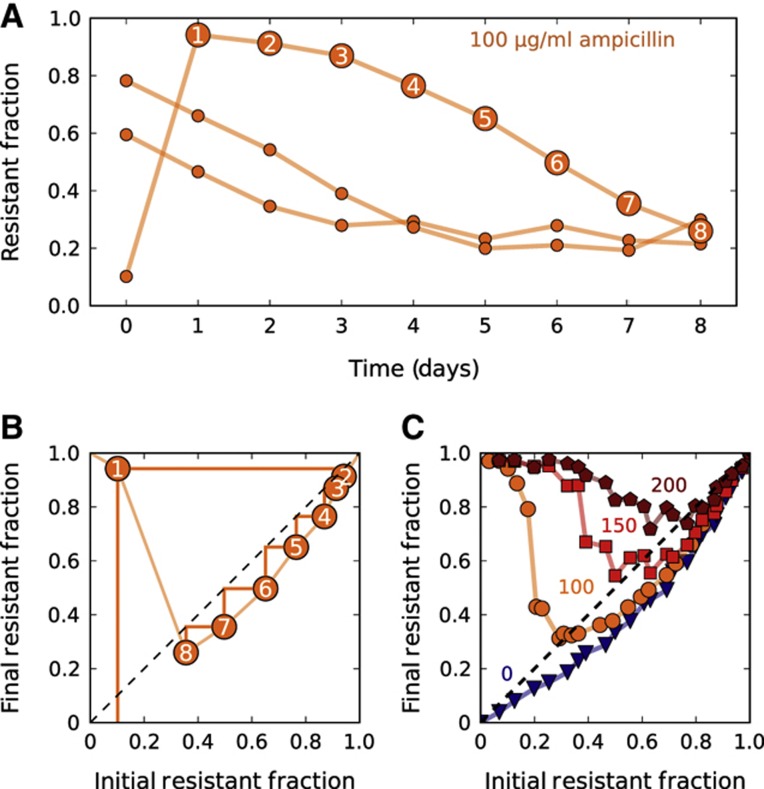
In the presence of resistant cells, sensitive cells can survive at otherwise lethal antibiotic concentrations. (A) Experimental time traces showing the evolutionary dynamics between sensitive E. coli and an isogenic strain that is resistant as the result of a plasmid containing a β-lactamase gene. A single resistant and a single sensitive colony were used to create three cultures with a different initial fraction of resistant cells. These three cultures were then grown for 1 day in the absence of ampicillin to make sure that resistant and sensitive cells experienced the same growth conditions (see Materials and methods). Then, every 23 h, the fraction of resistant cells was measured using flow cytometry, and the cultures were diluted by a factor of 100 × into fresh media containing 100 μg/ml ampicillin. Each data point represents a single flow cytometry measurement. (B) The orange time trace that starts at ∼10% in subplot (A) was replotted as a difference equation map that shows how the resistant fraction on day n+1 depends on the fraction on day n. The light orange line is an estimation of the difference equation. A simple trick to estimate the time dynamics with a difference equation is to use cobwebbing (dark orange lines), in which the daily dynamics are obtained by bouncing back and forth between the data line and the dashed diagonal line. (C) For each antibiotic concentration (indicated adjacent to each curve), a difference equation map was obtained experimentally by starting populations at 24 different initial fractions and measuring the final fraction after 23 h of growth. The intersection of a given difference equation map with the diagonal line represents the equilibrium fraction for that particular condition.

