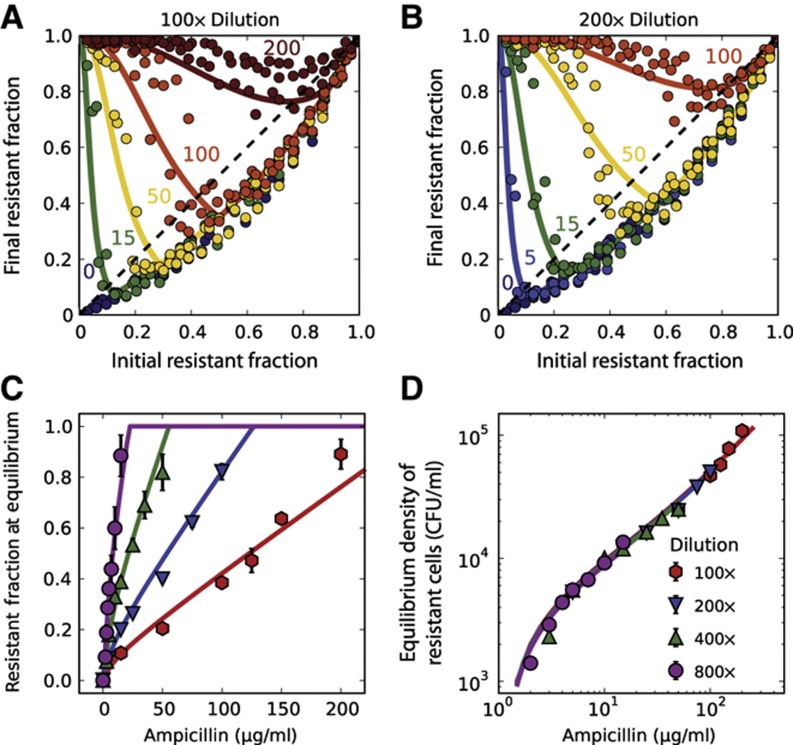
Figure 3.
Experimental difference equations confirm model predictions regarding the equilibria and dynamics of resistant and sensitive bacteria. (A, B) Experimental difference equations obtained at two dilution factors (100 × and 200 × ) and different antibiotic concentrations. At a given antibiotic concentration, an increase in the dilution ratio leads to stronger selection for resistance. Each difference equation plotted in (A, B) includes the data obtained on three different days. Measurement error from flow cytometry was typically smaller than symbol size. (C) The equilibrium fractions as a function of ampicillin concentration at four different dilution factors (see Supplementary Figure S13 for difference equations). The relationship is approximately linear for antibiotic concentrations higher than KM. The equilibrium fractions were extracted from the difference equation plots by determining the intersection between the difference equations and the diagonal line (dashed line in A). Error bars represent standard error of the mean (n=3). (D) Plotting the initial density of resistant cells at equilibrium as a function of antibiotic concentration reveals a data collapse that extends over two orders of magnitude in the concentration. (A–D) Solid curves show a single fit of the model to all the experimental data.

