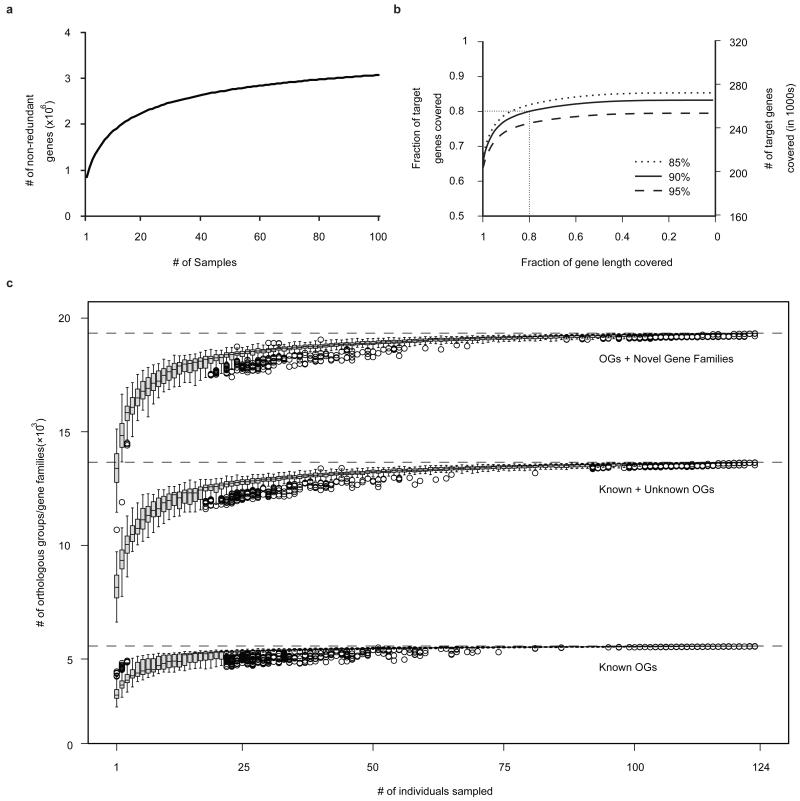
Figure 2. Predicted ORFs in the human gut microbiomes.
a, Number of unique genes as function of the extent of sequencing. The gene accumulation curve corresponds to the Sobs (Mao Tau) values, calculated using EstimateS21(version 8.2.0) on randomly chosen 100 samples (due to memory limitation). b, Coverage of genes from 89 frequent gut microbial species (Supplementary Table 12). c, Number of functions captured by number of samples investigated, based upon known (well characterized) orthologous groups (OGs; bottom), known+unknown orthologous groups (including e.g. putative, predicted, conserved hypothetical functions; center) and OGs+novel gene families (>20 proteins) recovered from the metagenome (top).

