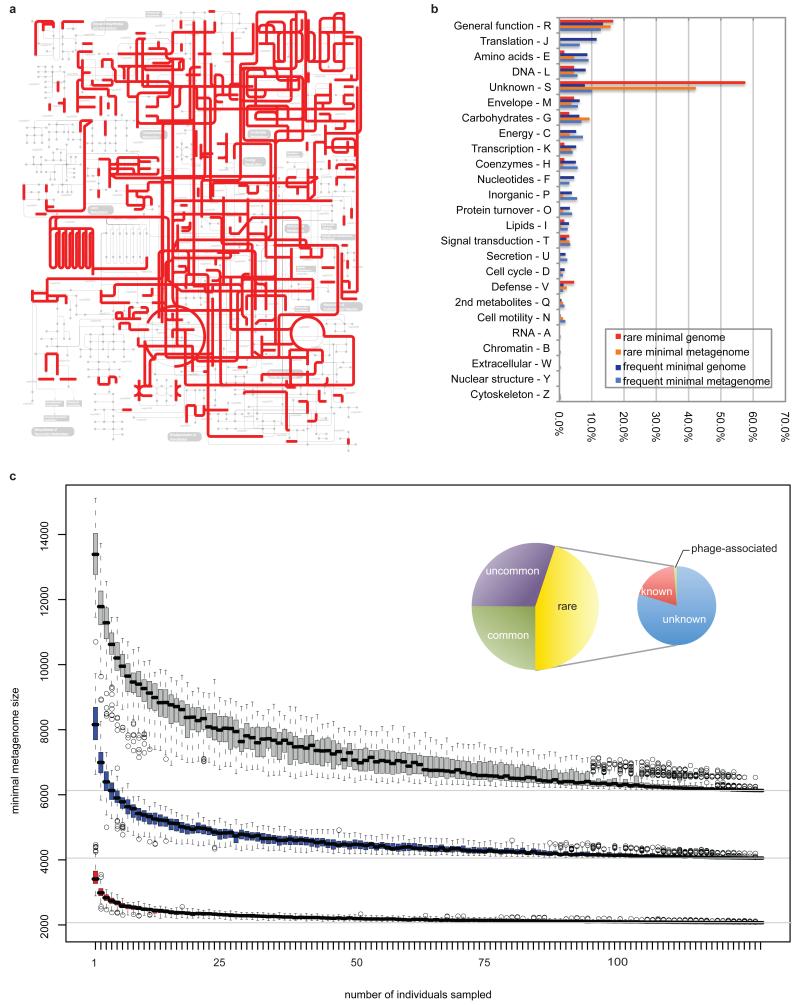
Figure 6. Characterization of the minimal gut genome and metagenome.
a, Projection of the minimal gut genome on the KEGG pathways using the Ipath tool38. b, Functional composition of the minimal gut genome and metagenome. c, Estimation of the minimal gut metagenome size. Known orthologous groups (OGs; red), known+unknown OGs (blue) and OGs+novel gene families (>20 proteins; grey). Inset: Composition of the gut minimal microbiome. Large circle: Classification in the minimal metagenome according to OG occurrence in STRING739 bacterial genomes. Common (25%), uncommon (35%) and rare (45%) are present in >50%, <50% but >10% and <10% of genomes, respectively. Small circle: composition of the rare OGs. Unknown (80%) have no annotation or are poorly characterized, while known bacterial (19%) and phage-related (1%) OGs have functional description.

