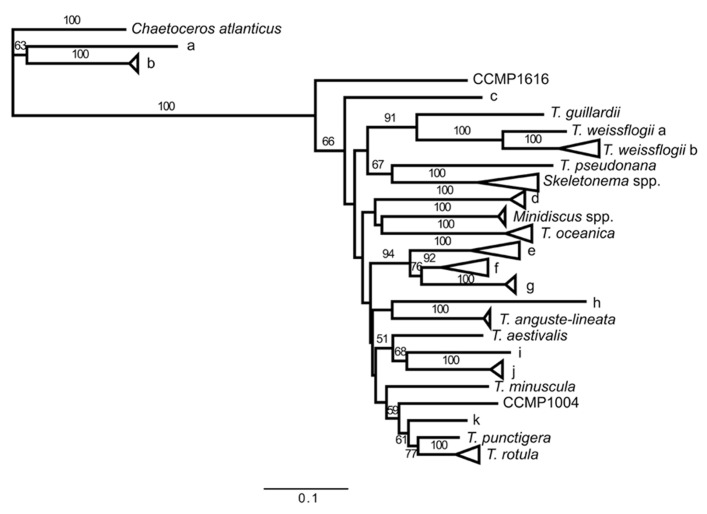
FIGURE 2.
Maximum likelihood tree of ITS2 sequences from GenBank® and field samples generated in the sequence analysis program Geneious® using the PHYML algorithm with the Jukes-Cantor substitution model and 1000 bootstraps. Sequences with >90% identity at the sequence level have been condensed into groups. Branch labels indicate the type strain of sequences within a branch if there is a species that has previously been described in the group. Throughout the figure Thalassiosira is abbreviated as T. If the group does not include a type strain, the branch was given a letter (branches a–k). Information on the sequences in each branch is listed inTable 2. Bootstrap values greater than 50 are indicated.

